


How a $28 Part Can Bring Down a $5M Machine — and How GenAI Stops It

Solutions Engineer, Neo4j
5 min read
Create a free graph database instance in Neo4j AuraDB
In mining, fortunes are won and lost not in boardrooms but in the quiet moments when a machine decides not to start. Picture a $5 million haul truck, engineered to move mountains, sitting idle because of a missing part that costs less than a dinner for two. The paradox is absurd, but it happens every day. And the reason isn’t the cost of the material; it’s that no one really knows which parts are the ones the whole system can’t live without.
The challenge isn’t just having materials in stock. It’s knowing which materials matter most, where to keep them, how they connect across machines, and what repair actions to take when failures occur. Traditionally, this knowledge is scattered across three silos:
- Bills of materials (BoM): The blueprint of assemblies and components
- OEM manuals: The technical instructions buried in thousands of PDF pages
- Maintenance logs: The record of what actually failed, how it was repaired, and what materials were consumed
By connecting these silos through knowledge graphs and making them explorable with GenAI, mining companies can finally unlock a digital twin of their equipment — one that reduces downtime, optimizes spare parts, and empowers technicians in the field.
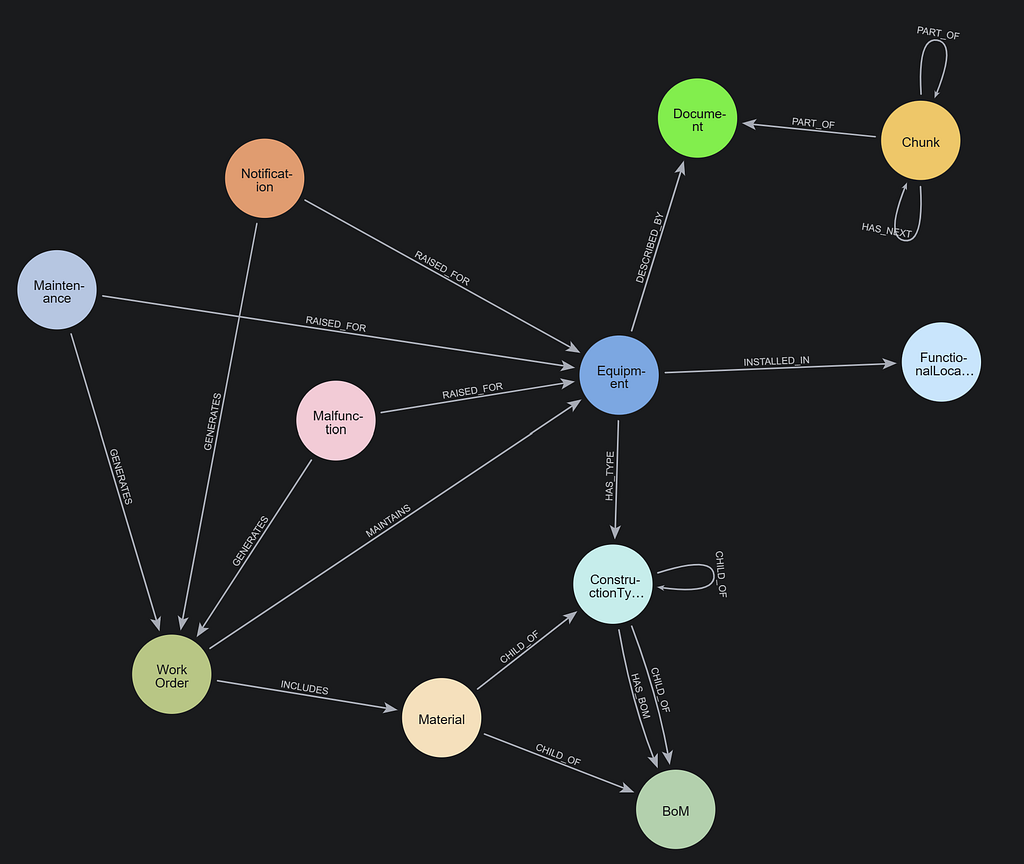
Have a look at this graph model connecting these silos. You will likely identify some fields (now nodes) from common ERP platforms like SAP.

The model is centered around the equipment from where we connect the BoM structure, the maintenance and breakdown events, and the technical documents. My colleagues Alex Gilmore and Chris Upkes developed a fantastic Python library to help chunk and extract entities from PDF documents (hopefully made public soon).
The Hidden Complexity of BoMs
A single mining machine can have:
- Thousands of parts across multiple levels of nested assemblies
- Multiple BoMs depending on version, retrofit, or regional variant
- Dependencies across fleets, where the same component appears in haul trucks, loaders, and drills
ERP systems like SAP capture this data, but make it hard to navigate. Maintenance teams often spend hours searching for part numbers or repair steps — time the business can’t afford.
With our knowledge graph, teams can navigate complex equipment structures to find answers quickly and uncover hidden dependencies. For example, a material is used so widely across machines that running out of it creates a massive operational risk.
The following image is a visualization of a BoM structure (assemblies and material in brown and teal) and the OEM manuals (green nodes) that describe the equipment (blue nodes).

And below is a visualization of how a specific type of lubricant oil (blue node) is shared across BoMs (orange nodes) and ultimately equipment (brownish nodes).

With this structure, GenAI can answer natural language questions with grounded evidence:
- “Show me the procedure to replace the hydraulic pump on Drill 320XPC, with part numbers.”
- “List the top five most frequently replaced components on Cat 16M graders and their total downtime cost.”
- “Which components are common to both haul trucks and loaders and how often have they failed?”
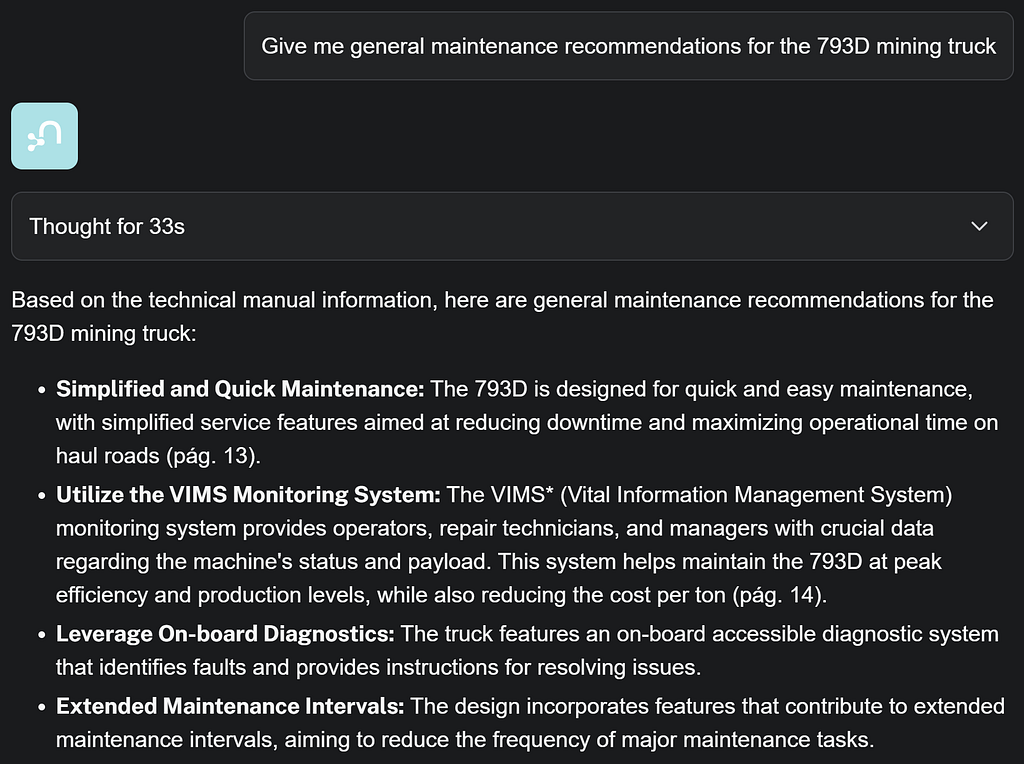
- “What is the load capacity of the 739 mining truck?”
Neo4j Aura makes this much easier with the Agent toolbar, where you can design tools tailored to different types of questions and let the agent automatically choose the best one to retrieve the answer. Here’s a sample of how that looks:

The Hidden Cost of Downtime
The economics of maintenance are counterintuitive:
- High cost of downtime: A single failure can cost hundreds of thousands of dollars.
- Low cost of materials: The failing component may be worth $50 or less.
The real challenge is identifying which materials are truly critical. In isolation, a gasket looks unimportant. In a network, that gasket may have high centrality, meaning it’s used across dozens of machines.
Graph algorithms expose these blind spots:
- Degree centrality: Materials that appear most often across BoMs
- Betweenness centrality: Materials that connect multiple machine types, acting as single points of failure
- PageRank: Shows which materials are most influential in the entire network of equipment dependencies, even if they don’t appear frequently
- Impact analysis: Centrality and downtime cost combined to prioritize stocking strategies
In our dataset, we found several striking examples, like a $28 motor oil lubricant with the highest centrality, shared across 131 pieces of equipment.
Summary
In the end, it was never really about the machines. It was about the small things that kept them running: the lubricants, the sensors, the bolts that nobody noticed until they weren’t there. Mining companies spend billions on fleets that look like rolling fortresses, but it turns out their greatest vulnerability costs less than a tank of gas. What knowledge graphs and GenAI give us isn’t just a new way to manage data; it’s a way to see the mine for what it truly is: a network of fragile dependencies, where knowledge is as valuable as ore. Miss that, and the $23 lubricant becomes the most expensive item in the pit.
Resources
- Neo4j AuraDB
- Managing Risk in a Manufacturing Plant With Neo4j Aura Graph Analytics
- Neo4j Use Case: Supply Chain
- How to Build a Knowledge Graph in 7 Steps
- Neo4j for GenAI
How a $28 Part Can Bring Down a $5M Machine, and How GenAI Stops It was originally published in Neo4j Developer Blog on Medium, where people are continuing the conversation by highlighting and responding to this story.
Share Article


Explore
Related Articles
The Context Gap: Why Your Smart-Sounding AI Struggles to Reason
From Data to Intelligence: Why Every Enterprise Needs an AI Knowledge Layer


Why Healthcare CIOs Can’t Afford to Scale AI Without a Knowledge Graph Foundation

Hey LLM, you’re using OPTIONAL MATCH wrong. Here’s the Cypher that actually works.
