Integrating Neo4j With Symfony: Profiling Queries and Centralized Logging

CEO of Nagels IT Consulting
4 min read

Efficient debugging and performance optimization are crucial when developing applications with Symfony. Whether working with traditional relational or graph databases like Neo4j, profiling queries and logging key actions can significantly enhance development efficiency and remove performance guesswork. This guide will walk you through setting up both the Profiler and the Logger in Symfony to monitor and optimize Neo4j database interactions.
Prerequisites
Before proceeding, ensure that your environment meets the following requirements:
1. PHP 8.1+
To access the latest and greatest of Symfony and Neo4j, you must have PHP 8.1 or higher. You can validate your PHP version using this command:
php -v2. Install Symfony
Follow the official installation guide if you haven’t set up Symfony yet.
3. Neo4j Instances (Neo4j AuraDB or Neo4j Desktop)
- Neo4j AuraDB: Set up a cloud-hosted Neo4j instance using this guide.
- Neo4j for Desktop: Install and configure a locally hosted database using this guide.
4. Composer Dependencies
Install the required packages to integrate Neo4j and set up logging:
composer require neo4j/neo4j-bundle
composer require symfony/monolog-bundle
composer require --dev symfony/profiler-pack
5. Configure Your Symfony Connections
Ensure that you have successfully set up and connected Neo4j Desktop or AuraDB. If not, refer to Connecting Symfony with Neo4j Desktop and AuraDB.
What Are the Profiler and Logger?
Profiler
Symfony Profiler is a component to analyze your Symfony application. Some key features that are interesting to us are:
- Query execution times: Tracks Cypher query performance
- Request profiling: Monitors database queries, routing, and controller execution
- Visual debugging: Provides insights via Symfony’s web-based toolbar
You can read more about the Symfony Profiler in the Symfony documentation.
Logger
Symfony’s Logger records logs during application execution. It helps track:
- Executed queries
- Errors and warnings
- Query execution time
- Database performance issues
You can read more about the Symfony Logger in the documentation.
Set Up Profiler and Logger
Step 1: Enable Neo4j Query Profiling
1. Create a Controller
Use Symfony’s MakerBundle to generate a new controller:
symfony console make:controller ProfilerTestControllerIf you encounter an error stating that the make namespace is not defined, install MakerBundle using:
composer require symfony/maker-bundle --dev2. Dependencies and Constructors
Edit the generated controller file src/Controller/ProfilerTestController.php to include the required dependencies.
The controller uses two primary services:
- Neo4j sessions: For database connections
- Logger interface: For logging the caught error
The complete controller code:
<?php

namespace App\Controller;

use Laudis\Neo4j\Contracts\SessionInterface;
use Laudis\Neo4j\Exception\Neo4jException;
use Psr\Log\LoggerInterface;
use Symfony\Bundle\FrameworkBundle\Controller\AbstractController;
use Symfony\Component\DependencyInjection\Attribute\Autowire;
use Symfony\Component\HttpFoundation\Response;
use Symfony\Component\Routing\Attribute\Route;

final class ProfilerTestController extends AbstractController
{
    public function __construct(
        private readonly SessionInterface $localSession,
        private readonly LoggerInterface $logger
    ) {
    }

    #[Route('/query-executor', name: 'query_executor')]
    public function executeQuery(): Response
    {
        $this->localSession->run('MATCH (n) RETURN n LIMIT 10');
        $this->localSession->run('MATCH (p:Person) RETURN p.name LIMIT 5');
        try {
            $this->localSession->run('MATCH (p:Person) RETURN p.name LIMIT 5 including some typo that i forgot to remove and will certainly crash the query!');
        } catch (Neo4jException) {
            $this->logger->error('Woops, something wrong happened. Don\'t worry our Symfony Neo4j package has already logged the error for us!');
        }

        return $this->render('profiler_test/index.html.twig');
    }
}
Step 2: Create the index.html.twig Template
Create templates/profiler_test/index.html.twig to display query results:
{% extends 'base.html.twig' %}

{% block title %}Neo4j Profiler{% endblock %}

{% block body %}
    <h1>Neo4j Query Profiling</h1>

    <article>If you have the debug bar enabled you can see what is going on in the backend! So cool, all I did was install the Neo4j Symfony package and run some queries</article>
{% endblock %}
This setup enables Symfony’s Profiler and the Logger to track query performance, centralizing logs for analysis and debugging.
Viewing the Queries
Symfony Profiler
- Navigate to your Symfony app and execute /query-executor.
- Open the Symfony Debug Toolbar (bottom of the browser window).
- Click on the Profiler tab to analyze database queries, execution time, and performance bottlenecks.

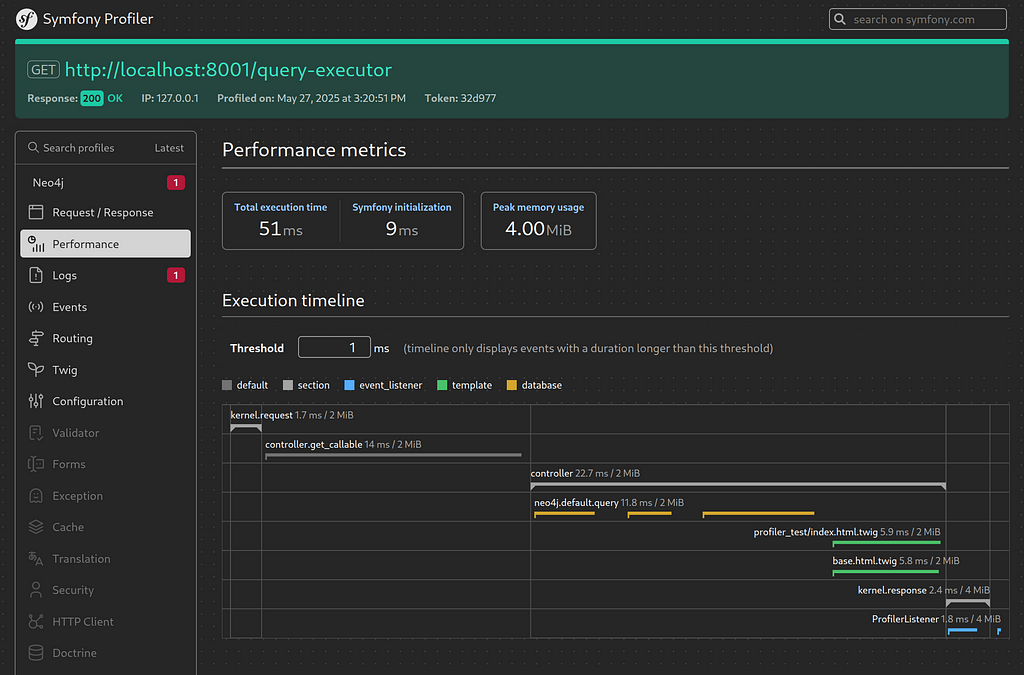
A general overview is available in the Neo4j tab:

You can also dig deeper and see how long every query took:
With debug logging enabled, you can even dig into all Bolt messages sent under the hood:

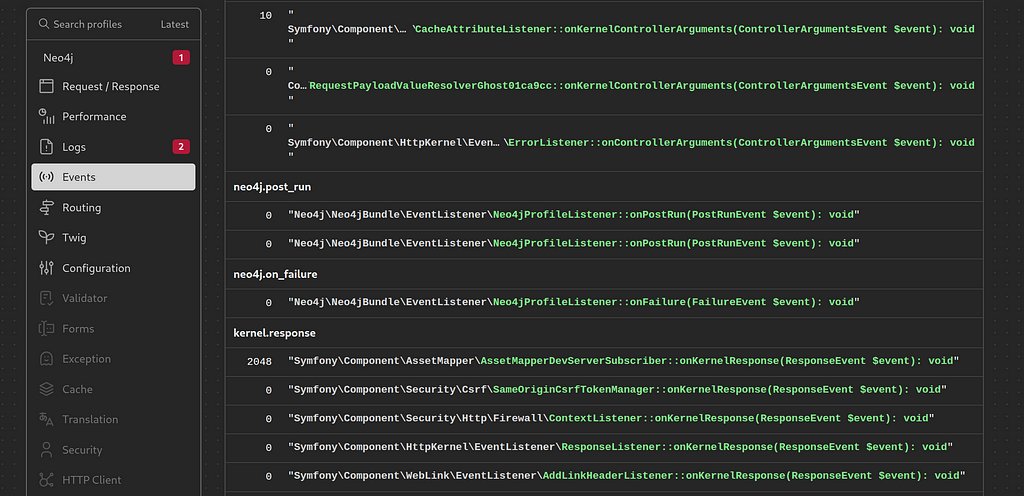
As icing on the cake, the bundle fully supports events:
Summary
By integrating Symfony’s Profiler and Logger with Neo4j, you gain deeper insight into query execution times, debug issues efficiently, and optimize application performance. Implement this setup to enhance your Symfony + Neo4j development workflow!
Integrating Neo4j With Symfony: Profiling Queries and Centralized Logging was originally published in Neo4j Developer Blog on Medium, where people are continuing the conversation by highlighting and responding to this story.
Share Article


Explore
Related Articles