Analyze Graphs Directly in Snowflake — The Wait Is Over


14 min read
Many organizations find themselves at a crossroads. Their vast datasets reside in powerful, scalable data warehouses like Snowflake, optimized for analytical queries and reporting. However, their most insightful questions aren’t about individual data points but about the relationships that connect them. Who influences whom? What’s the weakest link in a supply chain? Where are the hidden clusters of fraud?
Graph analytics offers the solution. By treating your data as an interconnected network, you can apply powerful algorithms to map influence, detect communities, and find critical links that were previously invisible.
This approach is already delivering significant value in the real world. Leading organizations use Neo4j’s graph analytics to combat financial fraud, optimize global shipping routes, help discover more effective treatment plans for patients, and more.
Fraud Detection at BNP Paribas
BNP Paribas Personal Finance faced significant challenges with fraud in its payment services, where traditional systems struggled to uncover sophisticated, hidden fraud rings in real time. By connecting their application data in a Neo4j graph, they built a powerful fraud detection system that could instantly query complex links between applicants, devices, and locations. This graph-powered machine learning model led to a 20-percent reduction in fraud.
Maritime Routing With OrbitMI
OrbitMI, a maritime SaaS provider, uses Neo4j Graph Data Science to power its routing platform. The graph analytics engine provides optimized routes that save time, money, and reduce carbon emissions, all with sub-second response times. Neo4j’s ability to analyze hidden patterns and relationships helps OrbitMI improve predictions and deliver a high-value service to optimize fleets and minimize supply chain disruptions.
Modeling Patient Journeys at AstraZeneca
AstraZeneca used Neo4j to model and analyze patient journeys to improve health outcomes. They built a graph connecting physicians, prescriptions, claims, and patients, and used NLP techniques to represent each patient’s journey as a unique document. Using similarity algorithms, they could then find patients with comparable medical histories, which proved effective in identifying individuals likely to develop a specific condition.
The Wait Is Over: Analyze Graphs Directly in Snowflake
A classic challenge organizations face: How can I run complex graph analysis without having to undergo a paradigm shift in how I store and handle my data?
“My data lives in Snowflake, but my questions are about relationships.”
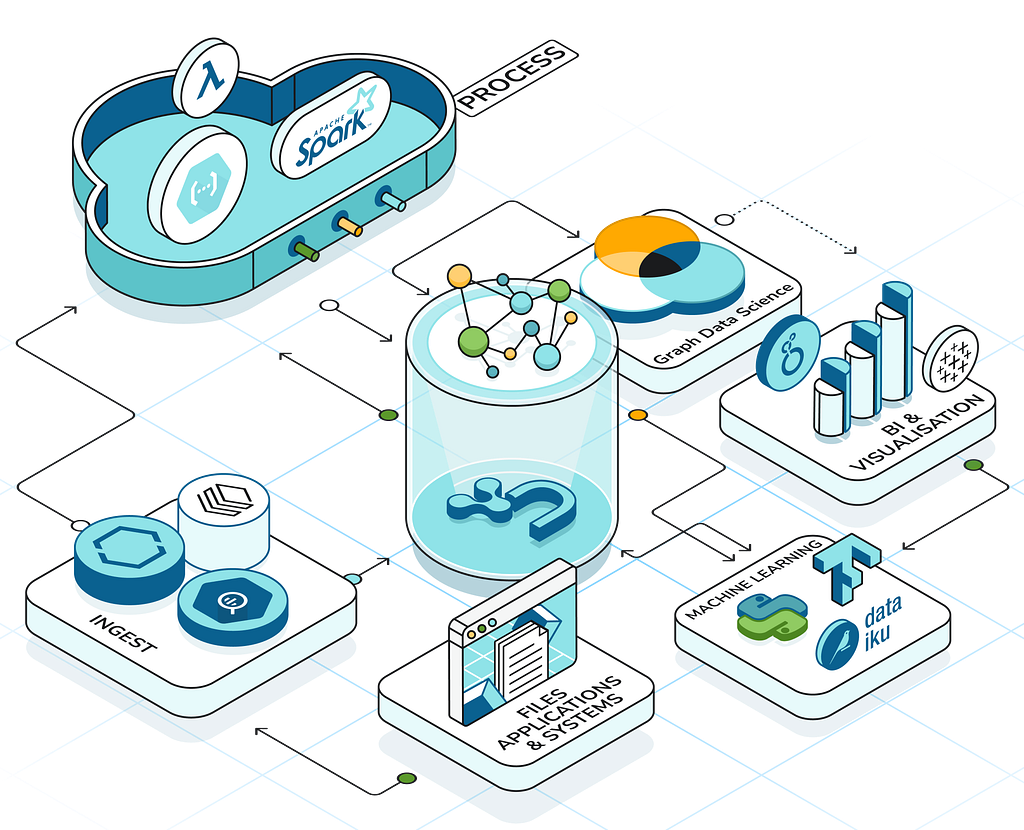
The answer lies in embracing a modern, agile approach: ephemeral or serverless graph analytics. With the release of Neo4j Graph Analytics for Snowflake in the Snowflake Marketplace, this is now possible! Imagine no longer needing to perform a massive data migration from your entire Snowflake dataset to a dedicated graph database. Instead, you simply project a precisely defined “slice” of data — only the information relevant to your immediate analytical question — from Snowflake directly into memory, ready for the Neo4j Graph Analytics engine to be deployed. This approach offers unparalleled flexibility and cost-effectiveness, delivering the best of both worlds.
Let’s Start With a Gentle Introduction
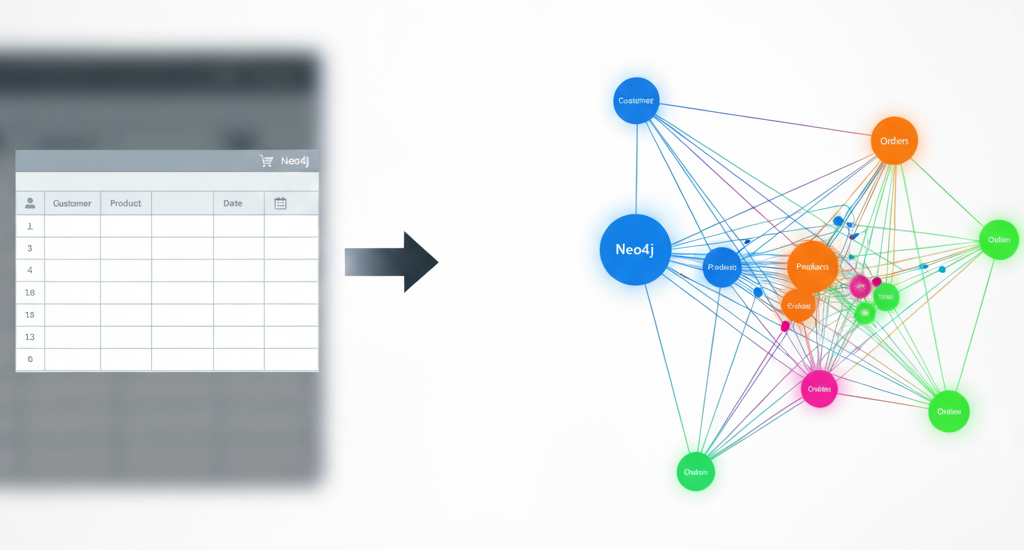
To demonstrate how we can go from flat, tabular data to a powerful graph, we’ll use a classic dataset: the CORA graph. While this graph is frequently used in graph machine learning experiments, it can also serve as a perfect example for many analytical use cases that modern organizations are coping with. Furthermore, the dataset comes in two CSV files, which serve our purpose of starting with a basic, real-world example of how to build and analyze a graph from data that doesn’t start in a graph format.
What Is the CORA Graph Dataset?
At its heart, the CORA graph is a citation network — a map of how scientific publications reference one another:
- Nodes: The nodes are the 2,708 scientific papers. Each paper has a unique ID and is categorized into a subject area.
- Relationships: The relationships are the 5,429 citations. If Paper A cites Paper B, we draw a directed link from A to B.
Each paper also includes two critical attributes stored as rows in our source CSV files:
- Category: Each paper belongs to a specific academic subject, such as Neural Networks or Reinforcement Learning, etc.
- Content vector: The text of each paper is represented as a binary “bag-of-words” vector, indicating the presence or absence of words from a dictionary.
This list of nodes and list of connections is a common way that connected data is stored in enterprise data warehouses. While academic, the CORA graph is a perfect template for commercial use cases. It wouldn’t be a stretch to reimagine this dataset as, for instance, a product recommendation graph:
- A
Papernode becomes aProductnode. - The
[:CITES]relationship becomes[:CO_PURCHASED_WITH]. - The content vector becomes a text embedding from the product’s description.
- The paper category becomes the product category.
In this context, finding “research communities” translates directly to discovering “product ecosystems” (e.g., items for camping or gaming), and identifying “seminal papers” becomes finding crucial “gateway products” that connect different categories. The exact same graph-based approach can deliver these powerful business insights.
Why a Graph Is Essential for This Task
You could, in theory, try to answer these questions using SQL in Snowflake, but this would involve complex, recursive queries that are difficult to write, brittle to maintain, and notoriously slow on large, interconnected datasets.
This is where a Neo4j graph projection excels. The questions we’re asking are about network structure, topology, and centrality — and Neo4j is natively designed for this, offering a powerful library of graph algorithms purpose-built to answer these questions with remarkable efficiency.
Let’s Get Practical
Alright, enough theory. Let’s get our hands dirty. The first step in any data project is to understand and stage your source data. For us, this means examining our two CSV files and loading them into Snowflake.
Examining the Source Files
We have two CSV files: node_list.csv and edge_list.csv:
- node_list.csv: Contains the information for each paper (our nodes), with columns for the unique ID, academic subject, and a features vector.
- edge_list.csv: Defines the connections (our relationships), with each row containing the ID of the citing paper and the ID of the paper being cited.
Staging and Loading Data Into Snowflake
The script below will create a new database, which, for this example, we call “cora_demo” and a default role. Our goal is to get these two files into two corresponding tables in Snowflake. As soon as the database is created, we can proceed with first creating the tables, then we upload the files directly into these tables using the Snowflake UI.
USE ROLE ACCOUNTADMIN;
CREATE OR REPLACE DATABASE cora_demo;

USE DATABASE cora_demo;
USE SCHEMA PUBLIC;

CREATE OR REPLACE TABLE NODES (
    ID          NUMBER(38,0),
    SUBJECT     VARCHAR,
    FEATURES    VARCHAR
);

CREATE OR REPLACE TABLE EDGES (
    TARGET_NODE_ID  NUMBER(38,0),
    SOURCE_NODE_ID  NUMBER(38,0),
    RELATIONSHIP    VARCHAR(50)
);
Set Roles and Permissions
Next, ensure that your user has the correct permissions to operate on the Snowflake instance (learn more about permissions):
USE ROLE ACCOUNTADMIN;
CREATE ROLE IF NOT EXISTS gds_user_role;
CREATE DATABASE ROLE IF NOT EXISTS gds_db_role;

GRANT APPLICATION ROLE neo4j_graph_analytics.app_user TO ROLE gds_user_role;
GRANT DATABASE ROLE gds_db_role TO ROLE gds_user_role;
GRANT DATABASE ROLE gds_db_role TO APPLICATION neo4j_graph_analytics;

GRANT ROLE gds_user_role TO USER <YOUR_USER>;
GRANT USAGE ON WAREHOUSE NEO4J_GRAPH_ANALYTICS_APP_WAREHOUSE TO ROLE gds_user_role;

GRANT USAGE ON DATABASE cora_demo TO DATABASE ROLE gds_db_role;
GRANT USAGE ON SCHEMA cora_demo.PUBLIC TO DATABASE ROLE gds_db_role;
GRANT SELECT ON ALL VIEWS IN SCHEMA cora_demo.PUBLIC TO DATABASE ROLE gds_db_role;
GRANT CREATE TABLE ON SCHEMA cora_demo.PUBLIC TO DATABASE ROLE gds_db_role;
GRANT SELECT ON FUTURE TABLES IN SCHEMA cora_demo.PUBLIC TO ROLE gds_user_role;
Loading Data With the UI Wizard
Now, load the data using the UI wizard:
- Load node_list.csv: Navigate to your NODES table and click Load Data. Browse for and select the node_list.csv file. Crucially, in the preview, you must click and drag the column headers to match the table’s order: ID, SUBJECT, FEATURES. Click Load.
- Load edge_list.csv: Repeat the process for the EDGES table with the edge_list.csv file, ensuring the columns match before loading.
Finally, run this verification script in a worksheet to confirm that everything loaded correctly:
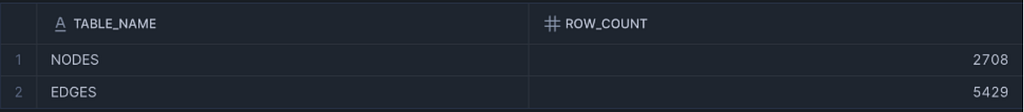
SELECT 'NODES' as table_name, COUNT(*) as row_count FROM NODES
UNION ALL
SELECT 'EDGES' as table_name, COUNT(*) as row_count FROM EDGES;
You should see the following output, confirming 2,708 nodes and 5,429 edges.
To Infinity and Beyond!
With our data loaded, the graph fun begins! We project a graph by creating two dedicated views, preparing the data for the graph algorithms:
USE DATABASE cora_demo;
USE SCHEMA PUBLIC;

CREATE OR REPLACE VIEW NODES_VW AS
SELECT ID AS NODEID FROM NODES;

CREATE OR REPLACE VIEW EDGES_VW AS
SELECT SOURCE_NODE_ID AS SOURCENODEIDsourceNodeId, TARGETNODEIDTARGET_NODE_ID AS targetNodeId FROM EDGES;
Now the entire world of graph algorithms opens up and is at our disposal. Any self-respecting graphista will want to run PageRank as one of the first algorithms. The PageRank algorithm is used to determine the relative importance of nodes within a network. It works by assigning a score to each node based on the number and quality of links pointing to it, with the core idea that a link from an important node carries more weight than a link from a less important one.
In practice, this algorithm is used to identify the most influential or central entities in a network. For instance, it can discover the most seminal research papers in a citation graph, or in the context of our product recommendation graph, it can find the products that are important from a co-purchasing perspective, etc.
Now let’s implement this on our CORA graph. With our tables now as a virtual graph in memory, we can easily deploy the Neo4j Graph Analytics engine:
USE ROLE gds_user_role;
USE DATABASE cora_demo;
USE SCHEMA PUBLIC;
USE WAREHOUSE <YOUR_WAREHOUSE>;

CALL Neo4j_Graph_Analytics.graph.page_rank('CPU_X64_XS', {
    'defaultTablePrefix': 'cora_demo.PUBLIC',
    'project': {
        'nodeTables': [ 'NODES_VW' ],
        'relationshipTables': {
            'EDGES_VW': {
                'sourceTable': 'NODES_VW',
                'targetTable': 'NODES_VW'
            }
        }
    },
    'compute': {
        'mutateProperty': 'PageRankscore'
    },
    'write': [{
        'nodeLabel': 'NODES_VW',
        'outputTable': 'CORA_PAGERANK_RESULTS',
        'nodeProperty': 'PageRankscore'
    }]
});
The results of the PageRank algorithm are stored in a newly created table: CORA_PAGERANK_RESULTS. We can now run a simple SQL query to collect the top five ranked papers based on their PageRank score.
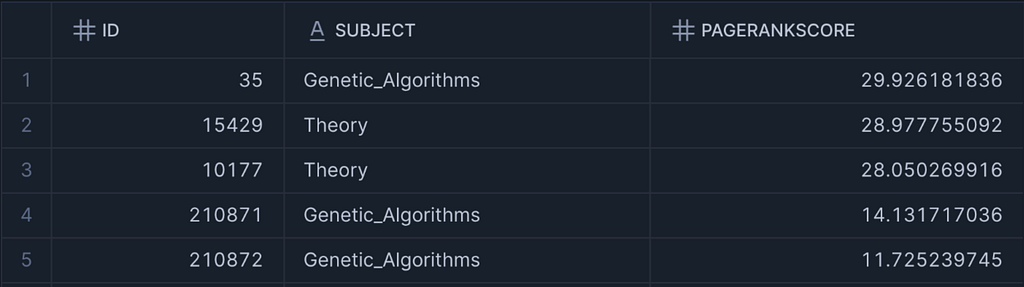
PageRank is a powerful and classic graph algorithm. In the CORA citation network, it helps us identify the most influential research papers by measuring the quality of citations, not just the quantity.
This same principle provides valuable insights when applied to our product co-purchase graph from earlier. PageRank identifies a product’s importance recursively: A product’s score increases if it’s frequently bought alongside other popular and influential items, even if its own sales are moderate. This technique is highly effective for cross-selling, as it can suggest non-obvious yet powerful product pairings.
The algorithm’s effectiveness has been proven across various industries.
Fraud and Anomaly Detection
PageRank is excellent at spotting unusual patterns of influence. In financial networks, it can identify accounts or entities central to fraud rings. For example, a single bank account receiving small amounts of money from many interconnected accounts can be flagged. This central account will have a high PageRank score within that sub-network, making it a prime target for investigation as a potential money laundering hub. Our colleague Michael Down wrote an excellent article on this.
Social Network Analysis and Influencer Marketing
In social networks, where users are nodes and connections are edges, PageRank is used to identify Key Opinion Leaders or influencers. A user with a high PageRank score isn’t just someone with many followers; they are followed and engaged with by other influential users. This helps businesses identify the true movers and shakers in a network for targeted marketing campaigns, moving beyond simplistic follower counts.
Supply Chain Optimization and Vendor Ranking
A supply chain can be modeled as a graph of trade relationships between suppliers, manufacturers, and distributors. In this network, PageRank helps procurement teams rank suppliers not just by their direct trade volume but by their connectivity to other influential partners. This allows them to identify critical suppliers who may not be the largest but are essential because they indirectly support high-value production chains.
And the best part? The power you just witnessed is now ready to be unleashed on every single dataset you have in Snowflake!
To Infinity and Further Beyond!
And there are many more goodies in the Neo4j Graph Analytics application.
There are more than 60 algorithms offered, or soon to be, in the Neo4j application that can extract value from your connected data. Broadly, they serve two objectives:
- Find implicit relationships in your connected data and establish new connections and insights.
- Learn from your data, which Neo4j ninjas also call “graph feature engineering.”
Various algorithms can be deployed as an example of the former. The node similarity algorithm, for instance, takes in a bipartite graph (a graph consisting of two different node types) and establishes a new relationship between two nodes of the same type based on nodes they have in common (thereby also creating a monopartite graph). Say I have a customer and product purchase graph where I have no relationships between customers. With this simple algorithm, I can find similarities between customers based on their purchases.
Furthermore, an example of graph feature engineering is exactly the example we showed earlier: computing PageRank scores. These scores, in turn, can be used in a retrieval workflow (the most influential papers or products), and they can also be used as actual properties when we convert the entirety into a vector.
Yes, you read that correctly! With Neo4j Graph Analytics, you can perform node embeddings. You can convert your nodes, their neighborhoods, and any properties that they may have into a rich and contextual vector. For machine learning practitioners and enthusiasts, this will feel like being a duck in a pond, since once we have these vectors, we can proceed down two major avenues: supervised or unsupervised learning:
- Once I have a vector, I can compute a distance function between vectors. In the Neo4j box, I can run a k-nearest neighbor algorithm, for instance, which creates a new relationship between similar vectors (subject to any similarity parameters I give it).
- Alternatively, suppose I have some labeled dataset (e.g., a subgraph containing nodes with a property with a specific label), I can train a node classification model, such as GraphSAGE, one of the more advanced graph neural network models offered in Neo4j Graph Analytics. This will allow me to predict classes (labels we trained on) to which any new nodes that we add to our graph belong.
The applications are nearly infinite, allowing you to truly learn from your data, find what is unusual, and predict what comes next.
Summary
With Neo4j Graph Analytics for Snowflake, we have a powerful and agile solution for organizations whose data resides in Snowflake but whose critical business questions are about relationships. By creating an ephemeral Neo4j graph from a relevant slice of Snowflake data, you can perform sophisticated graph analysis without the need for a costly and permanent data migration. This serverless approach offers immense flexibility, enabling you to leverage an extensive library of algorithms to uncover hidden patterns and drive insights.
Resources
- Neo4j Graph Analytics for Snowflake: Bringing Graph-Powered Insights to the AI Data Cloud
- Bring Graph Insights to Your Snowflake Data
- Neo4j Graph Analytics for Snowflake manual
- GraphAcademy
Knowledge Graph Fundamentals
Stop missing hidden patterns in your connected data. Learn graph data modeling, querying techniques, and proven use cases to build more resilient and intelligent applications.
Unleashing Neo4j on Your Snowflake Data was originally published in Neo4j Developer Blog on Medium, where people are continuing the conversation by highlighting and responding to this story.
Share Article


Explore
Related Articles

Why Healthcare CIOs Can’t Afford to Scale AI Without a Knowledge Graph Foundation

Hey LLM, you’re using OPTIONAL MATCH wrong. Here’s the Cypher that actually works.

How Graph Intelligence Drives Breakthroughs in Science and Society