Dual Indexing Neo4j and Solr for a Unified Platform

Senior Data Engineer, Thomson Reuters
10 min read
Editor’s Note: This presentation was given by Nathan Maynes at GraphTour New York in October 2019. At the time, Maynes was a Senior Data Engineer at Thomson Reuters.
In this post, we’ll delve into some use cases we have at Thomson Reuters, which is a group that works with state, federal, and local governments. What I want to specifically introduce is a project where we index all the information we have as a giant data company so our analysts and subject matter experts can easily search and receive the insights that they need.
Ultimately, what I’m hoping for is to spark more graph conversations with your colleagues or people in your organization.
Hierarchy of Search Needs
In 2017, Eric Pugh gave a talk about the hierarchy of search needs, which is a play on Maslow’s hierarchy of needs:
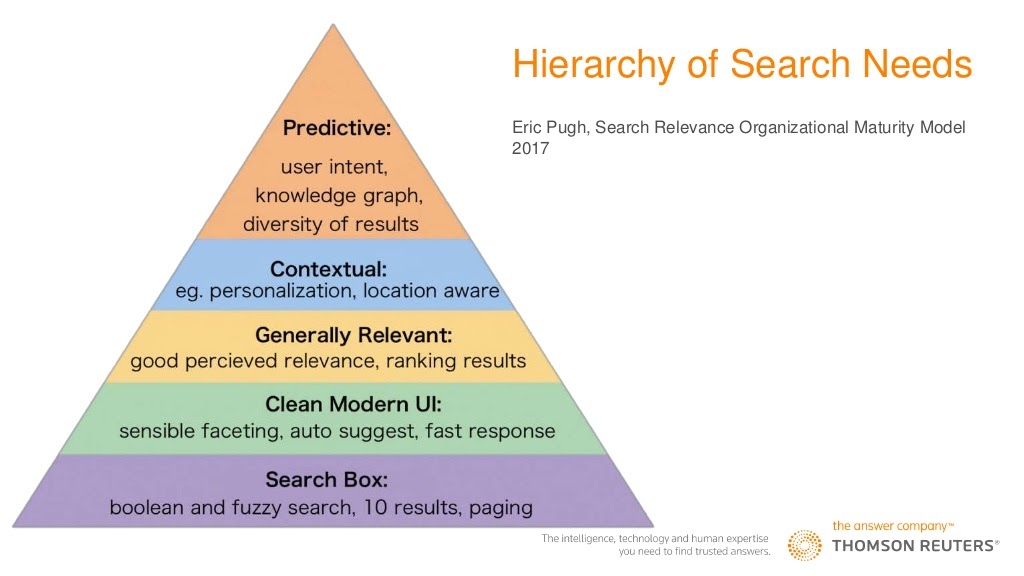
At Thomson Reuters, we take and parse dozens of different data sets. Some of them are ours, which we have a lot of control over, others are commercial fee-for service, and rest might be custom in-house datasets.
One of the problems we face is putting all that data into the hands of subject matter experts who can actually do things with it. Customers always come in with big data silos and tell us they want their search to work like Google. In this way, setting up our information in a graph helps us enable customers to look at more contextual or predictive search needs. It enriches the search results our subject matter experts want to see.
Data Nightmares
Everybody has had to deal with data that’s not always clean. This is my example:

Perhaps you share a nightmare like this or you’ve worked with data that makes about as much sense as this one does.
Knowledge Graphs
The reason I talk about data nightmares is that a lot of work goes into getting data into a knowledge graph. Here’s a glimpse into the scale we’re dealing with. In our knowledge graph, we’re currently processing:
- 74 data sources
- 1.7 billion triples
- 18,784,766 unique entities
- 7 leveraged open source projects
Much of what makes the backbone include some 8 million officers and directors, their positions, and the companies they’re related to. We also have over 10 million public and private companies that are all sitting on top of multi-node clusters. If you work for a company that has access to all of Reuters news content, you can continue to dump that into your data lake and not worry about running out of space.
Our knowledge graph is a bit smaller in scope compared to Google’s, Microsoft’s, Facebook’s, and IBM’s since we focus more on business dealings, officers, directors, and corporations. But, I will say that it’s fairly snappy – our Cypher queries come back pretty quickly, even for complex ones.
From Data to Graph
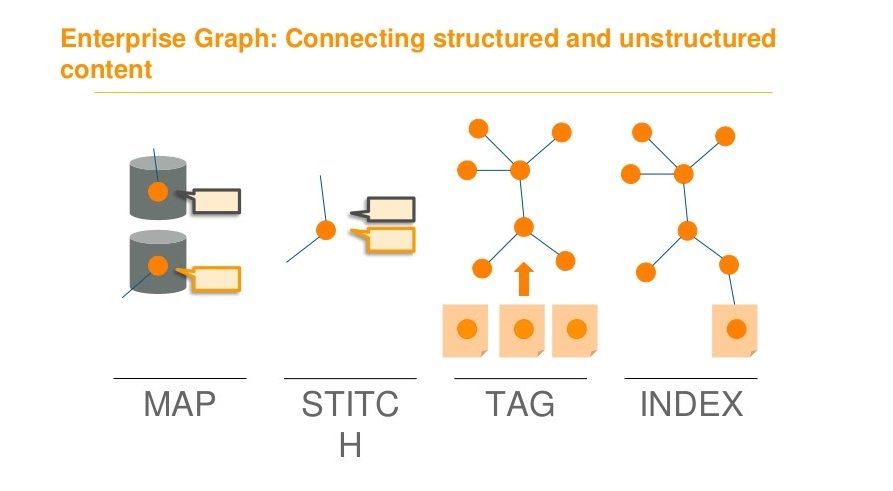
In order to get all the difficult data into a nice clean graph, we go through multiple steps, which we break down into a mapping stage, a stitching stage, a tagging stage, and an indexing stage:
The indexing phase is when Neo4j comes in, but before we can get there, we have to clean, prepare, and model the information.
The Mapping Stage
This stage is where we unify data attributes into a common vocabulary across data sources.
Oftentimes, you’ll have customers who have a totally different definition of something than you do. Everybody thinks about this little bit differently, and we need to make sure we’re domain aware. This is where mapping comes into play. It’s important for us to get definitions right, but also to be flexible enough to handle some of the ambiguities in the real world.
The Stitching Stage
Once all of that is done, you can move onto the fun stuff, which includes stitching things together. This entails taking entries from different data sources and representing them as a single entity with different pointers.
For companies with big data warehouses and complex joins, stitching is particularly useful. Otherwise, you’d have to create a new table with a new ID that points to all the other IDs you care about. On the other hand, in our graph, we just have a single entity that provides that view and gives us adjacency lookups so that we can look at all of our connected nodes. Moreover, the connection has a relationship, so we also know its type.
These models allow us to represent relationships in the real world that are much more ambiguous than columns and rows.
The Tagging Stage
Next, we go into tagging, which is something we’ve been doing for a long time since we process a lot of unstructured text. This is where we bring in the capabilities to tag and extract relationships and entities.
The key piece here is being able to resolve those entities as you extract them to something other than just a document. You want your graph to store these stitched views of entities so that when you’re tagging, you’re bringing it back to your model.
At Reuters, we process not only Reuters content, but also other unstructured content. We’ll tag, extract entities, resolve them, and then create relationship validation by inserting a relationship and a document to back that relationship up. This process is semi-supervised: we have machine learning models that run and extract information, but also humans and analysts who’ll go back in and validate them.
Even as you’re processing loads of unstructured content, you’ll be required to set up simple filters. This is where you need to use your brain and think about how you’re going to split up some of that information so that everything is in the right spot and you’re able to validate the right relationships.
The Indexing Stage
Lastly, indexing allows us to search all of this information. You might be used to using relational databases to do this or having an application that sits on top of relational databases to bring back information, but we’ve all been frustrated by search results that don’t read our minds and contain fuzzy matching or missing information.
We wanted to make this searchable for any analyst, including those who are less experienced and tend to type in words and hope that relevant stuff comes back. This is where our index comes in and where the choices we make about where that information lives starts to matter.
In our case, we have Solr for some of the free text Lucene searching that lets us cruise through free text documents. We also have Neo4j, which we use to do community detection, network centrality, and other fancy graph algorithms. Once we do all of this, we have a searchable index that our subject matter experts can gain insights from.
Architecture
This is how our architecture is set up:
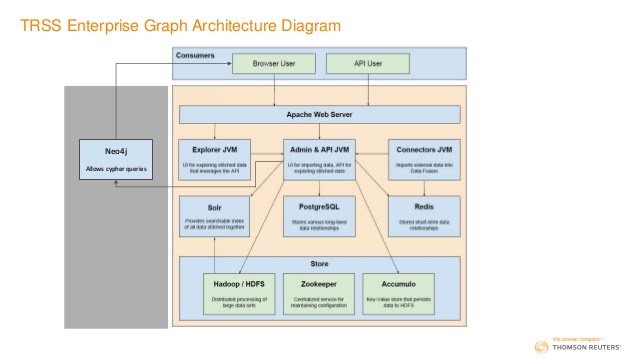
We have a whole stack that manages the resources of our computers and servers, then serves those up to a user and customer. In our gray box, we put the different kinds of indices we might want to use. In this example, we have Neo4j, which a user could access either directly or through an end-user web application. We also provide an API that allows them to call specific functions so that API users or developers on our team have access to the network’s information and other analysis tools they can bake into their applications. Moreover, breaking things down in this way allows data to enter in basically any format we can parse.
All of this allows the end user to find what they need. We want to show them information in a format they’re comfortable with, because ultimately we’re solving a search problem: we’re helping them traverse through all the information we have in our data lake.
Another major advantage is that we decouple the searching layer from the storage layer so that our storage can grow in whatever way it needs to. In this way, we can make tweaks to the searching layer without having to worry about what’s stored underneath.
We also want to leverage query languages that people are familiar with, and we support as many of those as we can. Additionally, we want to leverage algorithms written by and reviewed by multiple people, which the Neo4j Graph Data Science Library lets us do.
Lastly, we want to perform domain specific modeling. Again, when we build those indexes, we give an index to a customer in the way they need it. For example, if I call something a company but a customer calls them a customer, we provide them that context within that domain specific modeling.
Mapping RDF to Neo4j
This mapping process is extremely easy, and I included it just to show you how straightforward it actually is:
- Iterate over all of our relationships that exist in RDF.
- Look at each node and match it to all of the nodes it’s connected to.
- Merge all those paths to the relationships that matter.
Use Cases
Let’s talk about how to apply this to real-world scenarios. I’ve chosen three, all of which are different, since customers all have different domain specific languages.
Localized Centrality
The first one I’ll talk about is one that I really like, and the inspiration was actually from IMDb. If you’ve ever been on the website, you’ll see they have a section called the star meter, which tells you who is popular that week in the realm of movies including their ranking relative to all the other people in the database on a regular basis.
One of the things I wanted to do was take that much further. We used graph centrality algorithms to essentially help us compute page rank – or a small variant of that – on targeted populations.
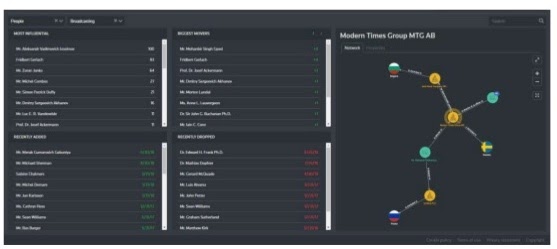
For example, you could see who the most influential players or companies were, and you would be able to facet that down from a single search display without recomputing everything.
What we end up doing is above on the top left with our most influential box, where we keep the network centrality. Here, you’re looking at who the major industries are. Then, we can filter that further down by geography or a handful of other facets.
But, you might be working with subject matter experts who already know who all the major players are – they don’t need that panel. What they need to know are the biggest movers. This is, essentially, computed centrality with a time stamp. Through this, you can see who has shifted the most and then drill down on the events that have helped that particular entity become more or less influential in a given time span.
This ends up being really useful for targeting exercises. If you need to learn about your customer supply chain or an industry you’re unfamiliar with, you can drill into the big movers and shakers.
You can also look at people that have been added or dropped from your networks. In this particular example, we’re watching almost 20,000 entities. We want one or two analysts to be able to monitor all of this so they can notify customers who are interested in movement within those spaces. This helps customers find what they need to look into or learn more about. Of course, we also provide graph view so that they can click and look at the relationships.
Relationship Validation
The other use case that we have is doing relationship validation via automated document processing. In this process, we go through and read a ton of content in Reuters and other news providers we partner with.

Accordingly, we’ll extract relationships and entities out of those documents. This allows us to watch relationships develop in near real-time, so they can wane, ebb, and flow. You can also move your time series to look at different time periods and see how certain relationships changed, which are all things you can do through relationship validations and automated document tagging.
Investment Trends
Of course, I’ve saved the best for last. This use case was one where we took all the investment data we have, modeled it in our graph, and then put the data on a map.
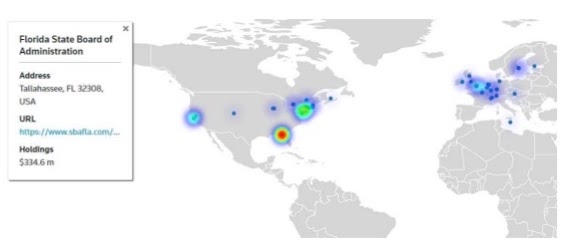
While we were doing this, something interesting happened. While we were cruising through and looking at Russian mining and the activity happening in that industry, we ended up seeing how a lot of money from Florida was flowing into a particular Russian mining company.
Digging into this a bit more, I realized wasn’t the only person that noticed this. Right around the same time, the Rolling Stone published an interesting article about how U.S. funds were going into sanctioned Russian companies. This is the kind of important insight we can achieve when we structure our data in a graph.
Next Steps
This is where I invite you, as somebody who’s interested in the graph community, to take action. Specifically, I’ve listed three means to do so:
- Entity resolution is still a big problem. If you know anything about it, you have any good ideas, jump on board. Last year, big tech companies identified this as an area where we have room to move towards an unsupervised learning method for tagging and resolving entities.
- Open identifiers: using them in your own datasets will help other people use them. Just a handful to mention: PermID, GRID, Wikidata, and Freebase.
- Graph literacy: No matter what stage you’re in, I’d invite you to become a graph advocate. You can do this by either writing a blog post about something that you’ve done using graphs, or become somebody at your organization that champions graph causes.
Lastly, I’d like to thank the open source projects, which have been invaluable to our process and the problems we’re solving. And again, I invite you to feel free with your becoming as a graph advocate.
You can find me on Twitter @nathanmaynes, and I hope to hear about your adventures in graphs. Thank you.
Register for NODES 2021 today and enjoy the talks from experienced graph developers.
Share Article


Explore
Related Articles

Why Healthcare CIOs Can’t Afford to Scale AI Without a Knowledge Graph Foundation

How Graph Intelligence Drives Breakthroughs in Science and Society