
Are Economists Right or Wrong? Connecting Patent Data in Neo4j

Undergraduate Researcher, University of Nebraska-Lincoln
4 min read

Editor’s Note: This presentation was given by Justin Ho at GraphConnect 2022.
Graph analytics has become a useful tool in economics to improve our understanding of patent data and the knowledge economy. Graph has given the economics field insights into citation trees, knowledge flows, collaboration networks between inventors, and the frictions that arise as a result of these patent collaborations.
The Knowledge Economy
Economists usually think of the economy as the production of goods and services. The knowledge economy isn’t that different: it’s the production of knowledge, new ideas, and new ways of doing things. Studying the knowledge economy makes us ask how different agents within the economy think about inventors. How do inventors interact with one another over time to produce knowledge? The discovery and dissemination of these new ways of doing things are the core of innovation and long-run economic growth.
Patent Data as a Graph
We chose to study patents because it’s a paper trail of innovation, all with publicly available data. Our reason for using Neo4j is that non-graph based data has a lot of limitations. Creating complex relationships can be very difficult and integrating other people’s work into your model is even more so. Using Neo4j and representing our data as a graph makes it very natural and contextual to understand what’s happening, and the speed and scalability Neo4j gives to our large dataset moves our research efforts forward.

The database schema above is from integrating data from the US Patent and Trademark office. Our data hase 13 million nodes and 110 million relationships, and in the center of these relationships are patents. We have inventors, a location of the patent, and an assignee, which is the eventual owner of the patent. Assignees can be the individual inventors, universities, or corporations. We also have some self-relationships, meaning patents can also cite one another and inventors can co-invent with other inventors.

This purple node on the left is Steve Wozniak. He invented four patents, which are all assigned to the blue node, Apple. All those patents are located in the orange node, Cupertino. This contextual view comes from just querying up Steve Wozniak with Neo4j Bloom.
Citation Trees and Knowledge Flows
How does this knowledge develop over time? This question led to us build citation trees, which look very similar to family trees.

This is a Neo4j Bloom representation of a citation tree. The root node is the patent that is cited by the first generation of patents. Citations of new patents are built on top of that. This provides a multi-generational view of patents being cited, created, and influencing one another.
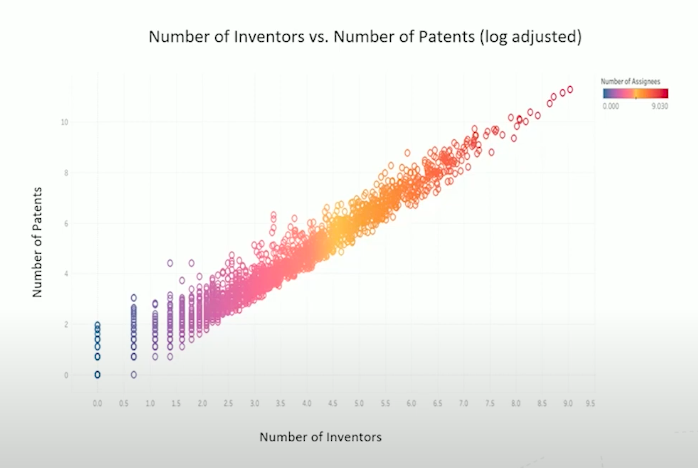
To understand this patent production process, we plotted the number of inventors and the number of patents they share on a log adjusted scale. That means that this linear relationship actually represents an exponential increase in the number of patents as the number of inventors increases. In other words, when it comes to patent creation, there are increasing returns to scale: doubling the inventors would more than double the number of patents generated. This is proof that technology builds on other technology, creating a virtuous cycle.
Collaboration Networks
Collaboration networks are what lead technology to grow exponentially over the long run. Collaboration itself is a type of learning as people build off of other people’s ideas.
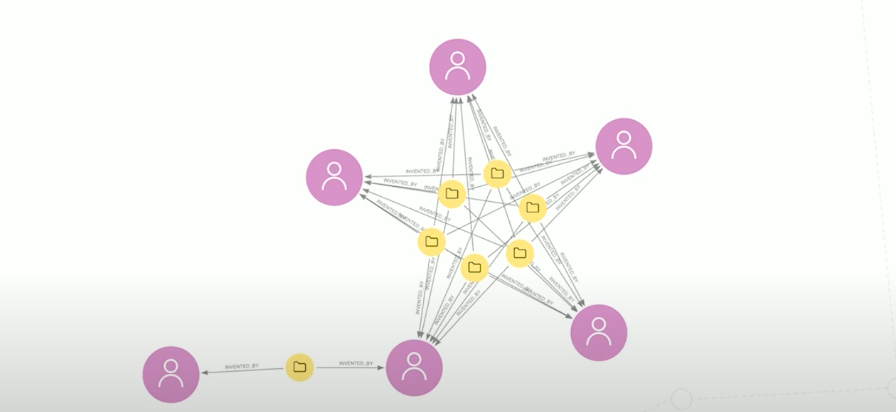
Here we have a Neo4j Bloom representation of a collaboration network, where you can see the relationships between these five inventors form a star shape. These inventors have worked together closely on multiple patents. There is one other inventor on the left, who has worked with only one of them.

We also zoomed out and plotted the whole collaboration network. It looks like a petri dish where you have a lot of islands of disconnected components. Looking at this made us wonder why the connections are so sparse and localized; perhaps the graph structure reduces sharing and creation of knowledge.
Frictions to Collaboration
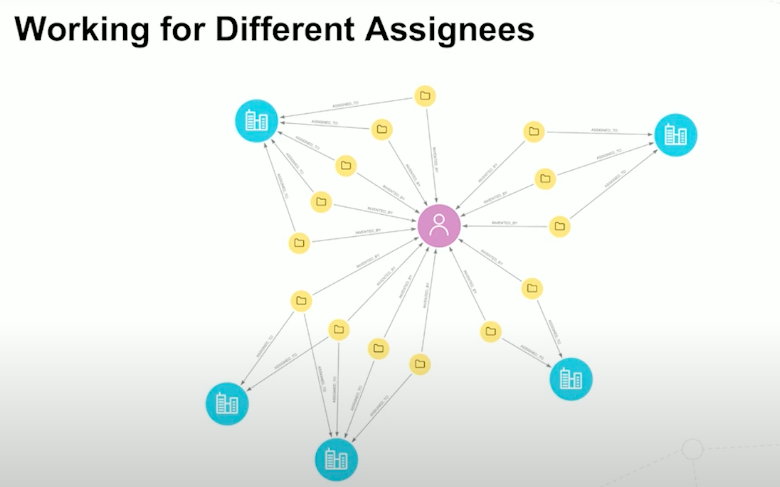
From this data, we wanted to study what keeps people from collaborating more widely and what the frictions to collaboration are. Knowledge creation isn’t like Facebook where you can send a friend request to say I want to collaborate with you and start working on a patent immediately. Economists like to explore the trade-offs to collaboration. On one hand, you gain ideas by working with other people, but on the other hand, people can steal your ideas. We decided to actually look at individual inventors and how they behave over their career.
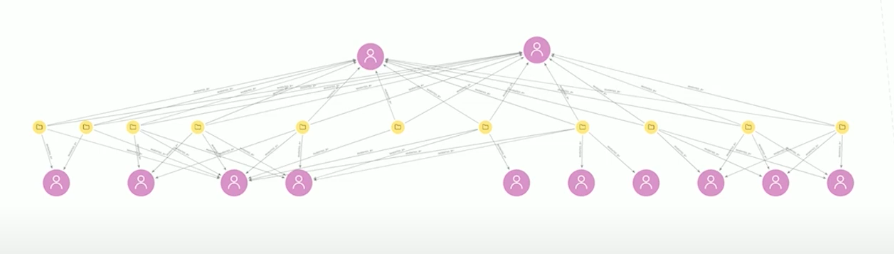
The top two purple nodes are inventors and they’ve worked together throughout their career inventing all these patents in yellow. While these two inventors work together consistently, they regularly work with different co-inventors. Neo4j Bloom has allowed us to capture this dynamic and look into how inventors switch companies and hop around.
One insight that came out of our analyses is how success influences collaboration. From our data, we found that after an inventor succeeds, they are less likely to take on a new co-inventor. This could be because productive people choose to keep to themselves or stay within their small group. We still don’t have confirmation of the underlying reason for this, but it does illustrate the richness of patent data, questions we can derive by using graphs, and how much we still have to learn about what drives innovation.
Share Article


Explore
Related Articles


15 Best Graph Visualization Tools for Your Neo4j Graph Database


Empowering Open-Source Cyber Threat Intelligence Analysis With Graph Visualization
