


Enabling Low/No Code Engineering Experience and Operationalizing Information Models

Vice President, APAC Marketing
5 min read

Editor’s Note: This presentation was given by Adi Dev Katiyar at GraphSummit Bangalore.
During Neo4j’s inaugural GraphSummit, we had the pleasure of hosting partners and customers to share insights and stories behind their connected data experiences. We will be featuring more of them in this series of blogs – so watch this space for more recaps.
For the eighth presentation in the series, we’re sharing a highlight from the Bangalore stop of the tour. In this presentation by Adi Dev Katiyar – Cloud Technology Architect, Yokogawa – we learn how the company drives digital transformation and unifies disparate information with knowledge graphs.
Enjoy! And for more information, please write to me at daniel.ng@neo4j.com.
Yokogawa builds hardware products and distributes control systems that fully monitor oil and gas refineries. Since our company is over 100 years old, we have many legacy assets which we cannot very easily transform into the digital world. We have slowly been evolving these assets by incorporating them into our knowledge graph, allowing us to bring in context and perform analytics.
Our products and customers work under extreme temperature and pressure conditions, so safety is of primary importance to us. Around 75% of our engineers are operational technology engineers, usually chemical engineers or instrumentation engineers. The remaining 25% of our engineers are IT experts. Our IT experts deal with many data islands that need to be integrated into our intricate global value chain. For example, we refine oil globally from Saudi Arabia or Russia, and throughout that process, the characteristics of the crude change. All of that information needs to be tracked and integrated into a knowledge graph.
Key Challenges
Our key challenges were:
- Digitally transforming automation systems to ensure we utilize our assets’ full capacity.
- Unifying disparate data sources distributed across multiple databases, tech stacks, and infrastructures. Usually, we’re not the only vendor serving a refinery, but we’re working closely with other companies like Honeywell, Siemens, and ABB to solve problems on-site.
To address these challenges, we needed to progressively build our different information models into a knowledge graph that works across all the refineries we work with. This is why we started working with the Neo4j Graph Database.
Engineering Enablement: Application Engineers and Domain Engineers
We needed to help both our domain and application engineers transfer knowledge in the form of graphs, which are intuitive and visual. Using a knowledge graph, we could templatize the information and use it across different refineries and customers, making the information scalable and transferable.
Neo4j’s design allows us to increase speed and agility and work across data sources. The knowledge graph bridges the gap between our IT engineers implementing our information models and our OT engineers with the models in their heads. The flexible structure of the graph data model allows us to combine the skills of these functions together in one technology.
Ease of Engineering Applications
Once we created models, we wanted to use them in our end-customer applications. For example, we can take a newly created graph model and apply it to a customer with a different set of variables, but the fundamental model is still the same. We can then go to another customer with different variables, but once again use the same model. This really increases the ease of engineering low- or no-code solutions because the solutions instantiate the model templates and bind them to real-time variables from our end users.
These models are of course never fixed and are evolving with the business scenarios. For example, doing business in Russia has become challenging because we are a Japanese company. As the process changes or the crew changes, the model will update how we can implement that change to make it easy for our engineers.
Other Use Cases
We want to be able to readily import the models drawn by our experts. Say an engineer has drawn a sketch of their mind map – how can they bring that hand-drawn mind map into a database or IT infrastructure?
Another thing we’re hoping to do is design performant models feeding into analytics and AI pipelines. This is a future-looking question for us. Our very first step is building the information models and adding context to them by incorporating all of our various IT data islands. Then we’ll start feeding these into analytics or AI pipelines and, of course, derive insights.
We’re always looking at how to build these knowledge tools on top of existing infrastructure investment. It’s never easy to replace the plant assets or the infrastructure, and we usually have to live with what is already at the plant site. This localization is one of the reasons we have so many data silos.
We need to be able to support intuitive and generic tech stacks throughout the model life cycle and want to adopt a stack that serves us end-to-end and across all use cases. Graph Databases help us do this, but so does GraphQL, a very open standard that’s promoted by even the Linux Foundation. The tech stack we’re building has to store our model templates, allow intuitive and performant retrievals and must derive insights by breaking down information silos and evolving our models.
Explore Graph Databases and Tooling

We started looking at what would be our appropriate tech stack. When we started this journey, graph database was not on our minds. Slowly, we discovered through our four criterias for evaluation that graph databases fit our needs and are quite intuitive.
In the first case, we are planning to use Arrows and Neo4j’s Data Importer. These would enable our engineers to depict in their minds what the information model would look like and translate that from a free tool into the graph database.
For storing information, we have the Neo4j Graph Database and Browser for storing information. For retrieval of these information models, we use Cypher and GraphQL. Insights are derived using Bloom and Neo4j Graph Data Science. Doing graph analytics is quite awesome in Neo4j.
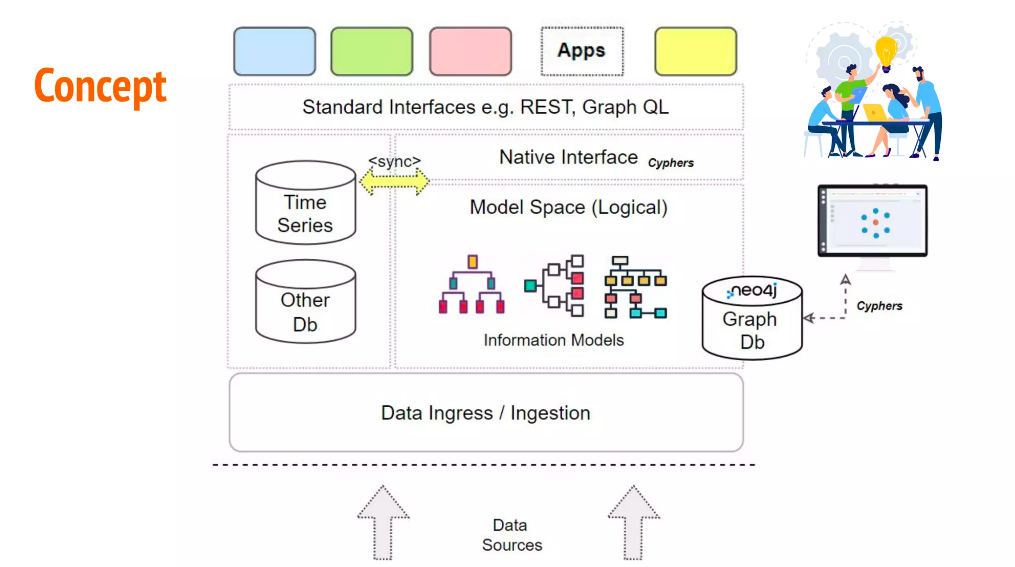
This is a bird’s eye view of the conceptual architecture we drew for Neo4j as one of our partners. At the bottom, we see data sources from our siloed systems at our sites and we ingress these into the cloud. We already have other databases like time series databases and PostScript for relational data storage. We then take these different data sources and sync those information models together with a graph. We then store the graph and all the context it provides (except for our time series database, which was too big to fit everything in the graph). We expose all this information to applications sitting on top of the knowledge graph for our customers to use.
We’re going to continue on our journey with Neo4j to enable low- and no-code solutions for our workforce. This is a fantastic path forward to integrate our models and support our application and operational engineers.
Share Article


Explore
Related Articles

Connected Intelligence: Scaling Graph-Powered Reasoning Across the AI Ecosystem
A Knowledge Layer For Your Agentic Systems on Google Cloud

The Context Gap: Why Your Smart-Sounding AI Struggles to Reason
From Data to Intelligence: Why Every Enterprise Needs an AI Knowledge Layer
