Evaluating Investor Performance Using Neo4j, GraphXR and ML

Co-Founder and Director of Business Development, Kineviz
6 min read

[Editor’s Note: The blog post and project is the result of a group of graduate students in the M.S. Business Analytics program at Santa Clara University. Learn more about these awesome folks below!]
Venture capital has become an increasingly popular and often necessary source of financing for startups in today’s current business climate. Small companies that lack access to other common sources of capital, such as bank loans or debt funding, can get necessary financial backing from wealthy investors in exchange for a share of ownership. VC funding is now so widespread, receiving it often determines whether a young company succeeds or fails.
With the explosion in the number of startups sprouting ideas all over the planet, there’s an inherent challenge for investors to find the proverbial needle in the haystack.
It’s no secret that most startups fail. And while multi-hundred-million-dollar venture funds are not uncommon, limited data and high risk means VCs remain selective in identifying startups with high-growth potential. With such large sums of money at risk the research process must be thorough, and investors may also look to co-invest with partners to limit risk and increase combined expertise.
This challenge exists on the other side of the equation as well, though taking on a different form. While drumming up financing is undoubtedly a huge source of stress for many cash-strapped founders, who would fault them for accepting a check from anybody willing to write one? Pitching and positioning an idea that appeals to deep-pocketed audiences, large and small, has its difficulties, and it’s obvious VCs are the party holding the most leverage.
Strategically Choosing the Right Investors
We set out to analyze this paradoxical problem for startup companies and their founders: How to not just obtain investment but partnering with the right investors.
While the famous adage that beggars can’t be choosers certainly carries some weight, there is undoubtedly more an investor can offer a young company than just an open checkbook. If that weren’t true, an investment from one VC would be exactly the same as an equitable investment from another.
But what makes a VC attractive to a young entrepreneur? Which characteristics should startups be looking at? A solid track record of notable portfolio companies is a great start, but we argue there is value in an investor’s connections within a broader network that may shed light on some previously underutilized attributes.
Data Visualization with GraphXR from Kineviz
Training and testing machine learning algorithms represent the heavy-lifting approach to solving this problem; we would know from experience. But for those who don’t have advanced degrees or technical skills, interactive visualizations provide fast, easy and understandable answers to nearly anyone. We found GraphXR from Kineviz to be an excellent resource in this regard, as we attempted to observe how network attributes contribute to an investor’s success.
We constructed a network of nodes representing different investors and edges representing common investments. A common investment was defined as two VCs investing in the same company, in the same round, on the same date.
Edges were weighted by the number of shared investments. The data was sourced publicly from Crunchbase, and after some initial data cleaning, contains individual tables for startups, investors, investments and relationships – perfect for injecting into a Neo4j graph database. This label-property graph structure allows us to create interactive and dynamic data visualizations effortlessly and effectively.
We can launch our visualization by using the query …
MATCH (n:Investor)-[:link_to]-(m:Investor) RETURN * LIMIT 1000
… to load a sample of the network.
It’s simple to explore the initial shape and structure through movement, rotation and zoom features, and the ability to identify the primary nodes central to the network becomes immediately apparent. Not surprisingly, many of these highly-connected investors are common names within the investment community: Greylock Partners, Y Combinator, Draper Fisher Jurvetson and Sequoia Capital, to name a few.
Exploratory analysis with GraphXR supports our initial hypotheses that not all investors have equal standing within the network.
For a budding startup that dreams of these VCs as ideal partners, it’s important to keep in mind they likely have their pick of ideas to fund. While it’s good to have a wish list, diving deeper into the network can help startups strategically come up with a more reasonable list of potential partners.
One way is to get as close as possible to these central investors, knowing that many deals involve multiple VCs and, therefore, proximity is a key attribute. By selecting one of them (let’s use Y Combinator) and adjusting the network into a tree structure, it becomes easy to see the hierarchy of first-, second- and third-order relationships stemming from the primary VC.
Notice that, while some investors looked far away from the center prior to this manipulation, they may in fact just be one step away from a major player – another benefit of the visualization tool. This may be an attractive finding for startups when making their shortlist of investors to approach.
Another option is to subset the investors by investment tendencies. We execute this by adjusting different parameters, including the current funding round and how active an investor they are. What we ultimately did for our machine learning analysis was sub-setting by industry, looking only at those who had invested in certain areas like healthcare, technology or services.
This was seen to produce stronger results in our models, and doing similar filtering here is quick and easy.
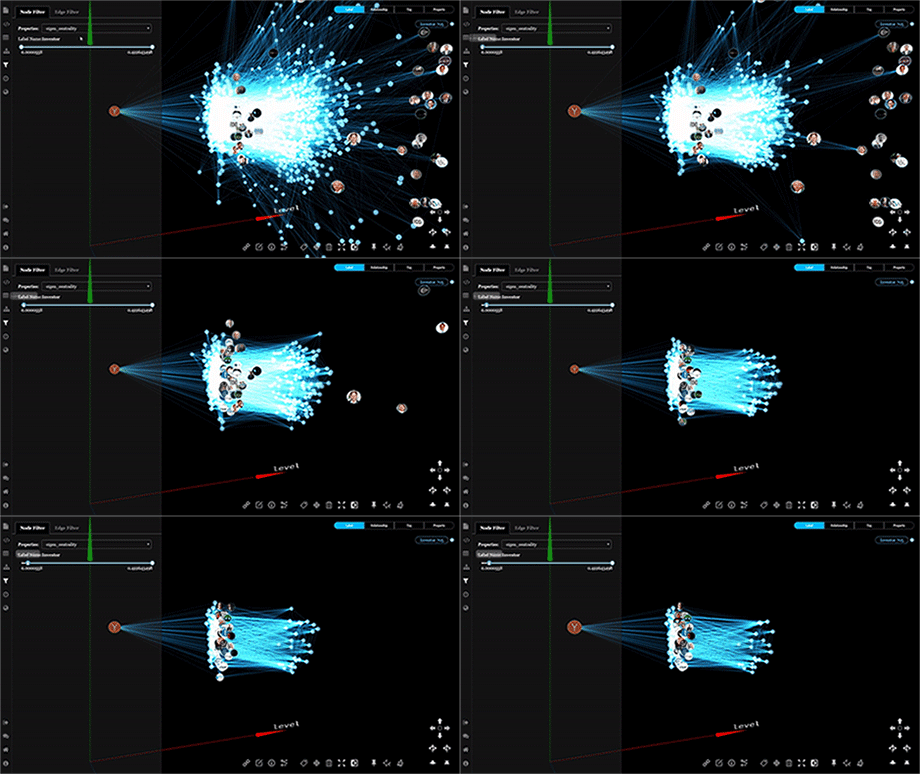
Through stepwise graph filtering, certain nodes will disappear that don’t meet the requisite criteria, and isolating the desired investors becomes easy.
After beginning with an entire network of over 1,000 investors, with a few easy clicks you have a set of investors who might be more accessible – ones that have historically invested in the industry of your startup and are closely connected to an industry titan.
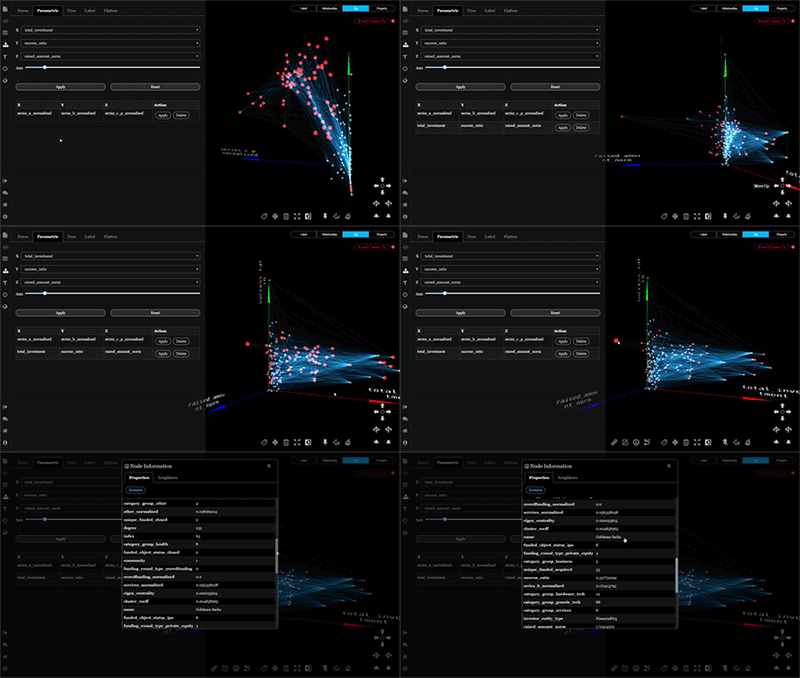
Now that our focus has narrowed to a smaller subset of investors, measuring them based on key metrics helps choose which ones are the best. Like everything up to this point, executing this is simple within this framework: choose your metrics for cartesian graphing and, voila, a plot that shows success, investments and round is produced.
From here, highlighting the investors in the upper right corners provides a startup with a solid list of reasonable VCs that would make good partners. They’re closely connected, have a historical pattern of investment in your particular industry and company stage, and have been shown to have a higher than average rate of success.
Conclusion
Leveraging technology like this is an efficient and scalable way to obtain quick and easy answers for common questions, especially if you’re not familiar with statistical modeling or machine learning algorithms.
Data visualizations through advanced graphical software can help derive quick answers, drive hypotheses and gain a better understanding of your network data in new and unique ways.
If you’d like to explore this data for yourself, or are interested in using GraphXR in your own work, sign up at graphxr.kineviz.com. Click “Select Demo” on the project page to access the VC investment 2004-2013 data.
Contributors
Amrita Sharma, Ben Richman, Jeff Glupker, Kyle Riener and Vinit Nair are graduate students in the M.S. Business Analytics program at Santa Clara University. Their analysis was carried out with guidance from members of Credit Suisse Labs and Kineviz. As a group, and individually, they continue to pursue their passion for combining data science, machine learning and visualization in industries such as finance, marketing, healthcare and technology.
Read this white paper The Power of Graph-Based Search, and learn to leverage graph database technology for more insight and relevant database queries.


