Evolving an Enterprise with Graph Technology

Lead Architect of Commerce Services, Dell Technologies
7 min read
Editor’s note: This presentation was given by Hari Nair at NODES 2021.
At Dell Technologies, we’ve been using graph technology for about four years now, and have productionalized multiple systems that use graph databases. In this post, I will be covering how graph technology has enabled our architecture at Dell Technologies to evolve. I will show the many ways in which connected data and graphs have helped us transform our systems.
There are two areas I’ll be covering. One, is how graph has helped in our data journey, and two, is how graph has fundamentally transformed our systems. I’ll spend more time on the data journey side of the story. This is about how we evolved our systems from monoliths to microservices, and ultimately to a true service cloud. The second side of the story is a transformation story of how individual systems or processes have benefited from using graph and connected data. With that said, let’s dive right in.
Our Data Journey
Let’s start with the data journey side of the story. This model shows at a high level how we have tried to improve our system scale and performance characteristics.
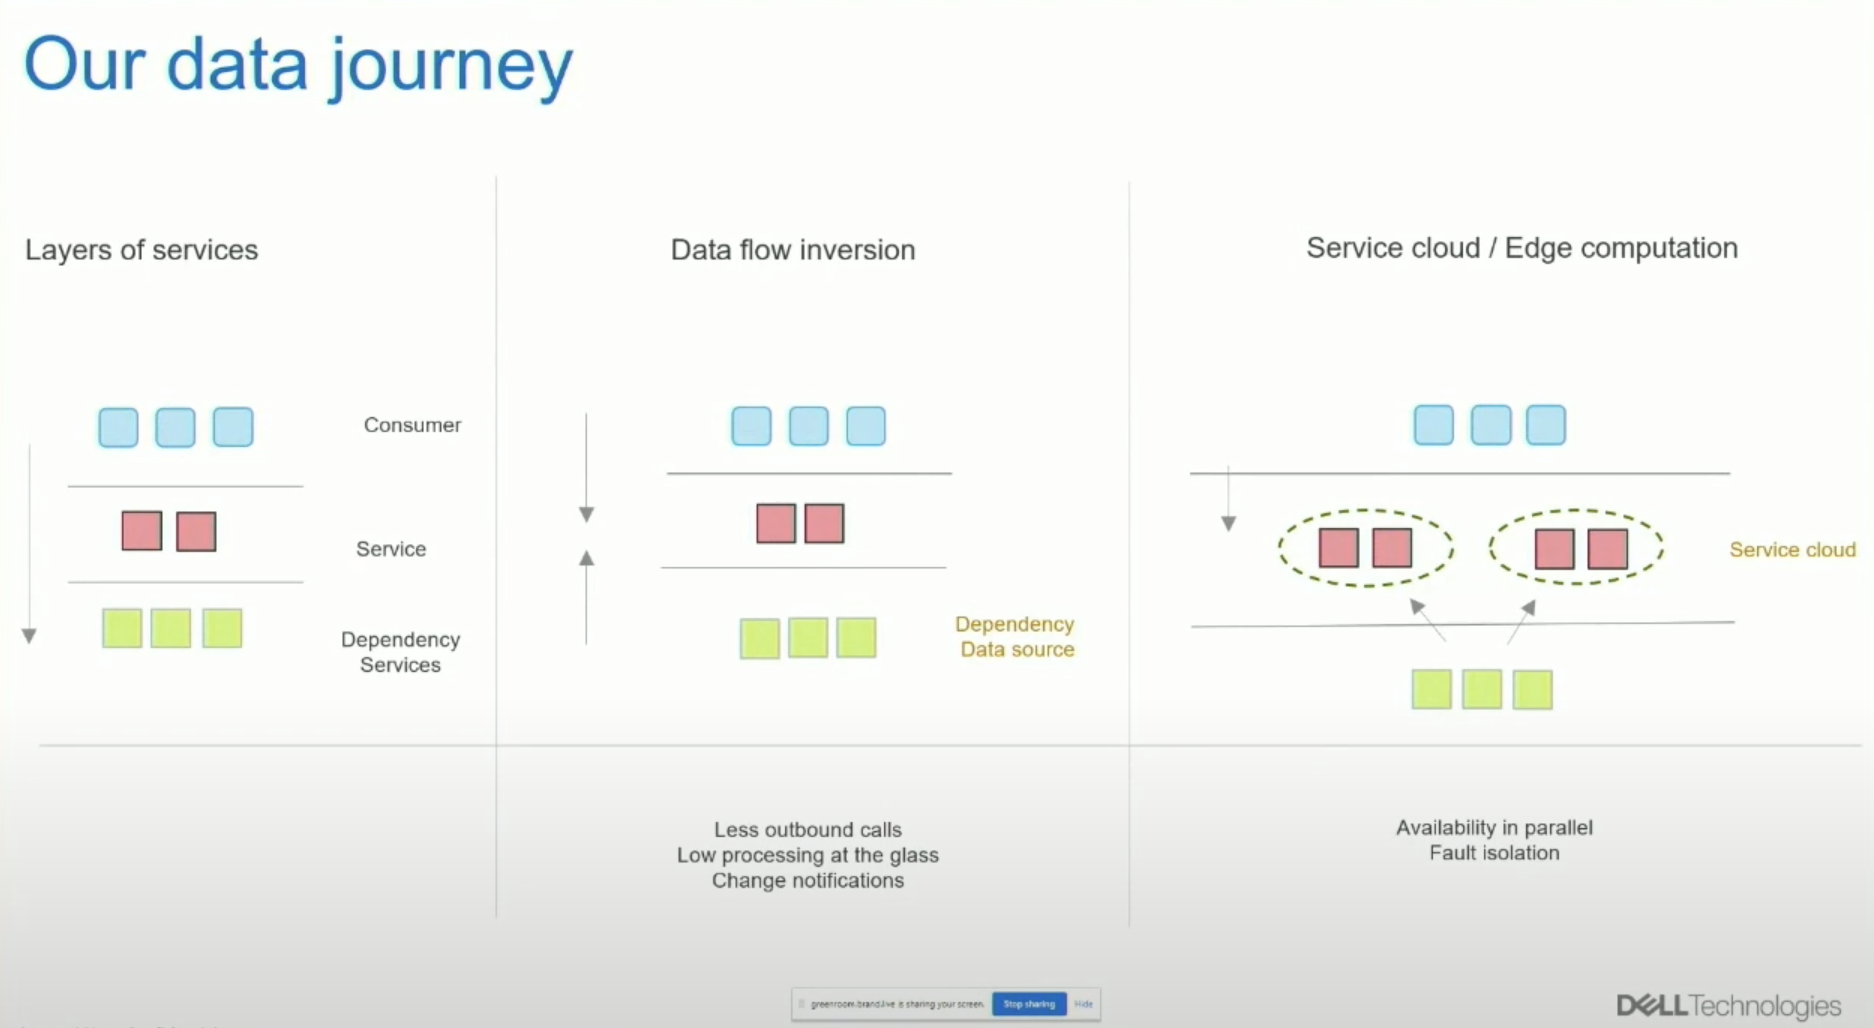
In blue, we have the consumers, the people who are going to consume our services, the services themselves in red, and the dependencies that are producing data or other common services to these services in green. This model consists of services calling other services, dependency services, and the main services that the consumers connect to. While transforming from monoliths, this gave us a significant problem: availability in series.
Availability and Performance
The availability of the system as a whole here is a function of the main service and all of its dependency services as well. This makes it hard for us to achieve some of the high availability numbers. Also, from a data perspective, the data is at rest, still stored as how it was authored. Some optimizations can still happen, but fundamentally, it is authored data waiting for services to transform them for the end users.
Performance here is a function of all the services in the call stack put together. To address this, we tried to invert the flow of data from the service to the dependency, and the other way around, from the dependency to the service, where it becomes a data source. The association of the service and the dependency for this to happen needs to occur ahead of time; this means before consumption happens, which makes availability of the dependency a function of the main service itself.
By processing some of the response stack ahead of time, we get some performance improvements as well. Now, this pre-processed data is closer to being consumable and is a step beyond the raw author data that we saw in the left side of the story.
Lastly, to be truly cloud and infrastructure-agnostic, we created the ability to send this consumable data directly to the consumer, like in edge processing. This architecture gives us availability in parallel. We can create multiple edges serving a single customer, creating redundancy between those instances, and by separating these instances from each other, we allow fault isolation. This creates a system with high availability and performance characteristics. Also, by sending the pre-assembled data to the edge, the edge is simpler and scalable as well.
The Role of Graph Technology
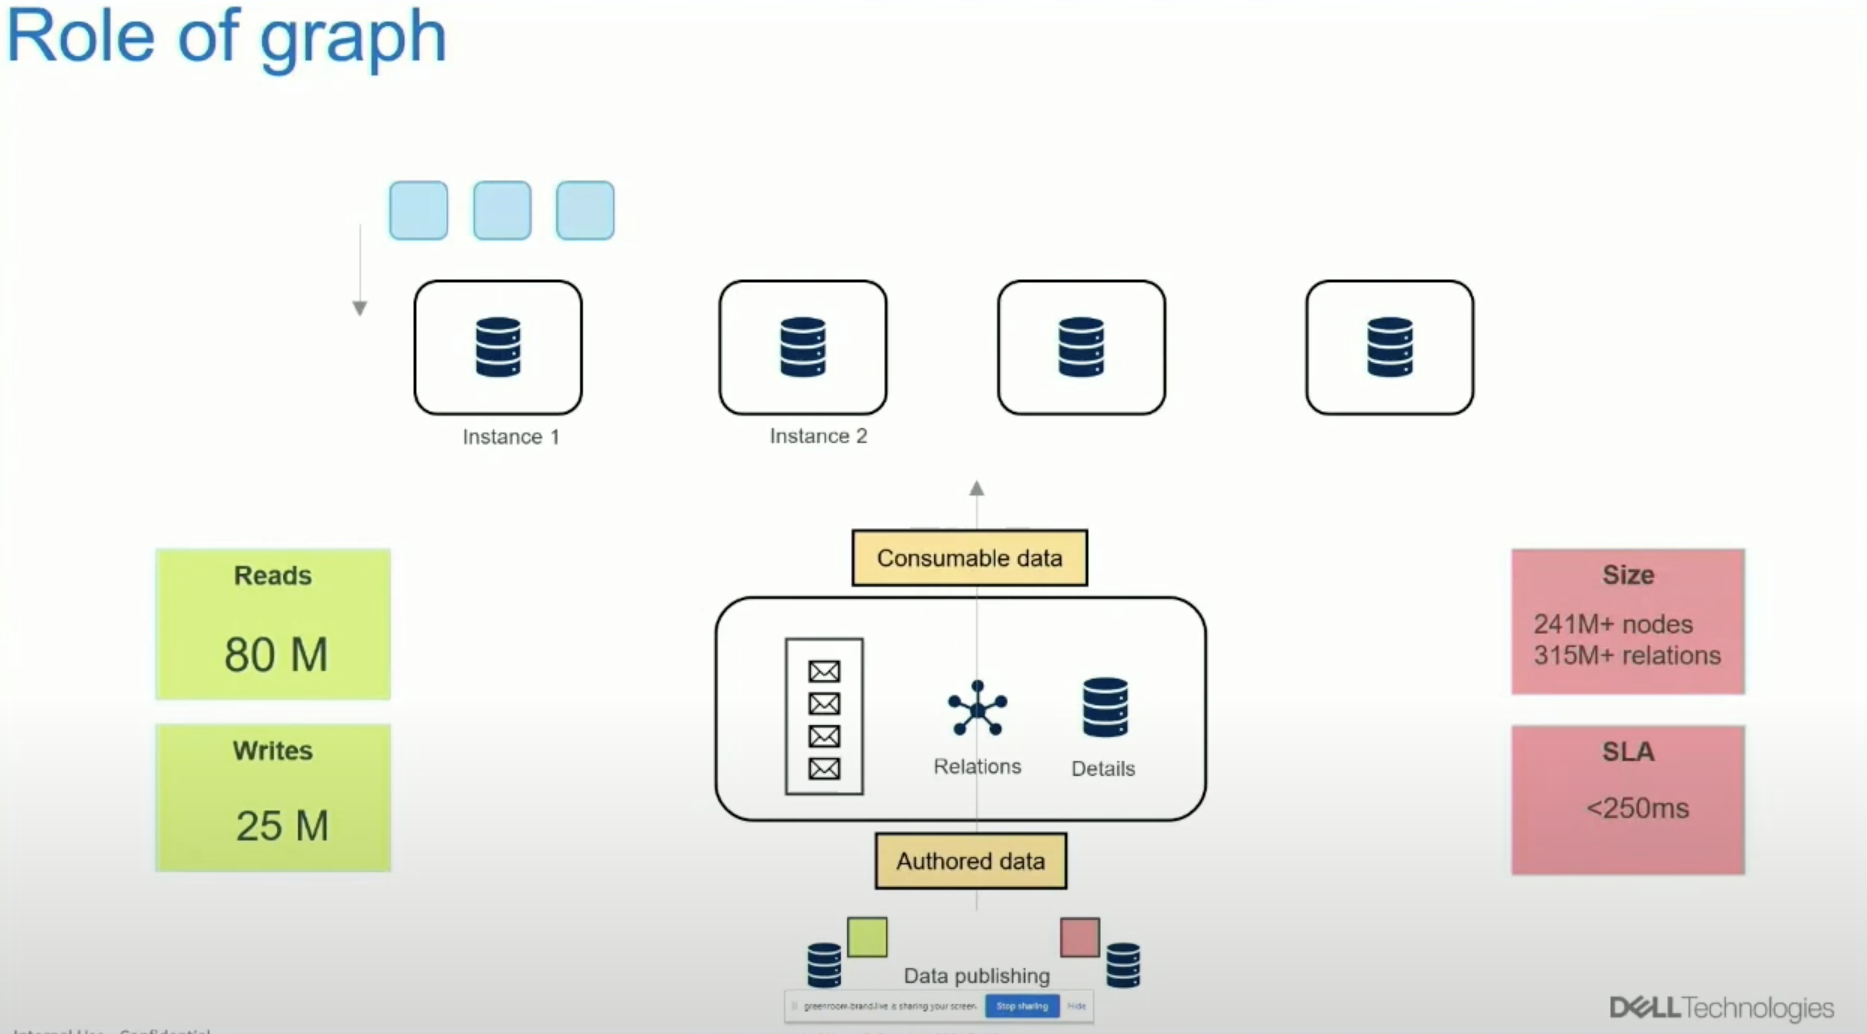
We started using graph technology to glue the separate systems in our enterprise together. By interlinking entities that were previously stored in separate databases, graphs unlocked the ability for us to bring this data together for the purposes that we saw in the previous model. Using graphs exclusively to store relationships between entities, and augmenting graphs with other database technology to store details, we were able to bring data that was previously disconnected, together.
Let’s dive a bit into the details here. Say we have a service, and let’s say that it is managing some entity called A. Let’s also say that it depends on two additional dependent entities, B and C. Let’s also say that historically, A, B and C were big enough and diverse enough that they had to be stored in separate systems and managed separately. Traditionally, when trying to serve a consumer, the call stack starts with A and involves invoking B and C, and B and C have to produce output specific to what A asked for.
With graphs, we are able to represent relationships between A, B and C. Traversing from A to B and C for any given instance of A, we can discover the complete data context for that specific instance of A. This can then be sent to the edge to be served as needed. So in a sense, via using graphs as a processor, graphs can author data to consumable data, and the output of the graph traverses are then sent to the edge. When any of the entities change, we can traverse our way to its associations, figuring out exactly what has been updated. We can think of this as like a true depth-first traversal up to dependencies: if B changes, C or E changes.
Engineering challenges we worked through were typically dependencies at more or less logical expressions. Graphs are different from logical expressions. So, to build those conditionalities of ANDs, NOTs, ORs, and nesting, we had to build systems that are capable of interfacing these expressions with the graph.
The Advantages of Graph
With graphs, we’re getting a true point-to-point traversal system; when any of the vertices change, we can easily find the impact in a depth-fast way. Being truly schema-less, the data set we are using can be changed easily and new behaviors can be added easily as well. With a graph, we have fine control of how the traversals happen. By changing very few generic traversal functions, whether they are written as user-defined procedures or Cyphers, we have control of how the system functions.
Here are some numbers for a graph database on one of our systems:
- 80 million reads and 25 million writes per day, each under 250 milliseconds
- 241 million plus nodes
- 315 million plus relations
Benefits from getting data to the edge include good scale and good performance. There are secondary benefits as well. Since A, B, and C were linked, the cause and effect of a change is immediately apparent, which is a significant upside for authoring when we’re talking about different teams working together in a workflow, trying to keep the systems up. Since all of the attributes are available within the graph, they are available for authoring processes themselves.
Transformation Using Paths
I’ll share a couple of examples of how graphs and paths have helped transform our systems. We started by bringing together separate data entities with graphs. Once we had diverse entities stored within a graph, we took advantage of the traversability of the graph to deliver significant outcomes.
![]()
Forward Chaining
The first type of transformation we could do is forward chaining. Say we have an entity A that is going by the rules of entity B, like in a validation system. By mapping A and B together, we can find all valid forms of A based on its relations with B. From here we build suggestion engines, auto resolvers, and other systems.
Projections
What the second transformation graph allowed us to do is a traversal anywhere in the graph. You can find any type of label or any specific node and then traverse any direction you want. This gives you the ability to pivot and project your data on any attribute because all of these nodes are either a table themselves or attributes in a table. This is truly powerful because traditional databases do not let you do this, and you can find new service domains really easily.
Graph Algorithms
Lastly, I want to talk about how we’ve put graph algorithms to work to transform some of our systems. There are a couple of ways in which we did this: community detection and similar entities.
Community Detection
Algorithms like Louvain and PageRank can be used to determine the connectedness between entities. The real life examples of systems could be entities that are connected with common sets of relations. Community detection derives local pools of nodes that are connected to each other and gives them unique community IDs. It is also possible to derive directionality between these communities. First, you have a bunch of nodes that are separated. Then, you figure out which nodes are more strongly connected to each other. This is very effective in use cases like human or machine networks to determine what group of people is talking to each other or what machines are talking to each other to achieve certain tasks.
Similar Entities
The last example I want to touch upon is similarity. By representing states as paths, we can use similarity algorithms to find the unique states that are most similar to each other. We can also find how they vary. This is beneficial in any system that uses atomic changes in state to deliver value.
Conclusion
Connected data is everywhere, and graph databases are a truly crucial tool to understanding these connections. As with any technology, graph tech has a reason and a purpose. My advice is please experiment, learn, and be ready to change as you go. Thank you.
Share Article


Explore
Related Articles

Mastering Fraud Detection With Temporal Graph Modeling

What Are the Different Types of Graph Algorithms & When to Use Them?


Turning Your Tabular Data Into a Graph Using Cypher