
How to Explore SAP Sample Data in Neo4j – Graph for ERP Part 2

Senior Cloud Partner Architect, Neo4j
5 min read

Purpose
The use of graph databases for data exploration is becoming increasingly popular in various industries and as we have seen previously, complements and can even modernize existing technologies in your stack. This article aims to provide a step-by-step guide for those modernizing their ERP using Neo4j graph to gain valuable insights through exploration and graph data science.
Enterprise Resource Planning (ERP) systems are widely used by manufacturing companies to manage various types of data, such as customer information, product details, employee records, and addresses. Users can gain a holistic view of the entire ERP system from a single interface by utilizing a graph database as a medium for exploring such diverse data.
In my last blog, How to Graph an ERP System in 3 Easy Steps, we saw how Neo4j can be integrated with the SAP ERP system using the GCP SAP connector. In this article, we are going to demonstrate the process of loading sample SAP entities from a GitHub repository – including but not limited to business partners, products, employees, and sales orders – into a Neo4j graph database. Once the data is loaded, we will analyze and explore the relationships between these entities to gain insights and extract meaningful information.
This article is designed to be a comprehensive guide for those seeking to harness the full potential of graph databases in their SAP data analysis and exploration efforts.
Challenge
To extract data from SAP, there are a couple of challenges. It requires access to different SAP modules, such as sales and distribution, production planning, human capital management, IT support, and a thorough technical knowledge of SAP. Customers usually use integration tools, like GCP SAP Connector in the enterprise world, to extract data.
Our focus is to learn how we can explore SAP entities in Neo4j graph. To keep it simple, we will use SAP sample data from GitHub. This repository contains the SAP Data Warehouse Cloud Bikes Sales Sample database that includes data from these tables:
- Addresses
- BusinessPartners
- Employees
- Product Categories
- Products
- SalesOrderItems
- SalesOrders
Let’s Talk About the Data Model
The ERP model is widely recognized as complex, even more so when custom tables and attributes are introduced. Neo4j has an ETL tool that can intelligently understand the relational database data model and convert tables and foreign keys to nodes and relationships. As a part of the ETL configuration, it offers the flexibility to select or ignore attributes and select an attribute as a label. Here is the pictorial representation of a relational schema to graph data model conversion.
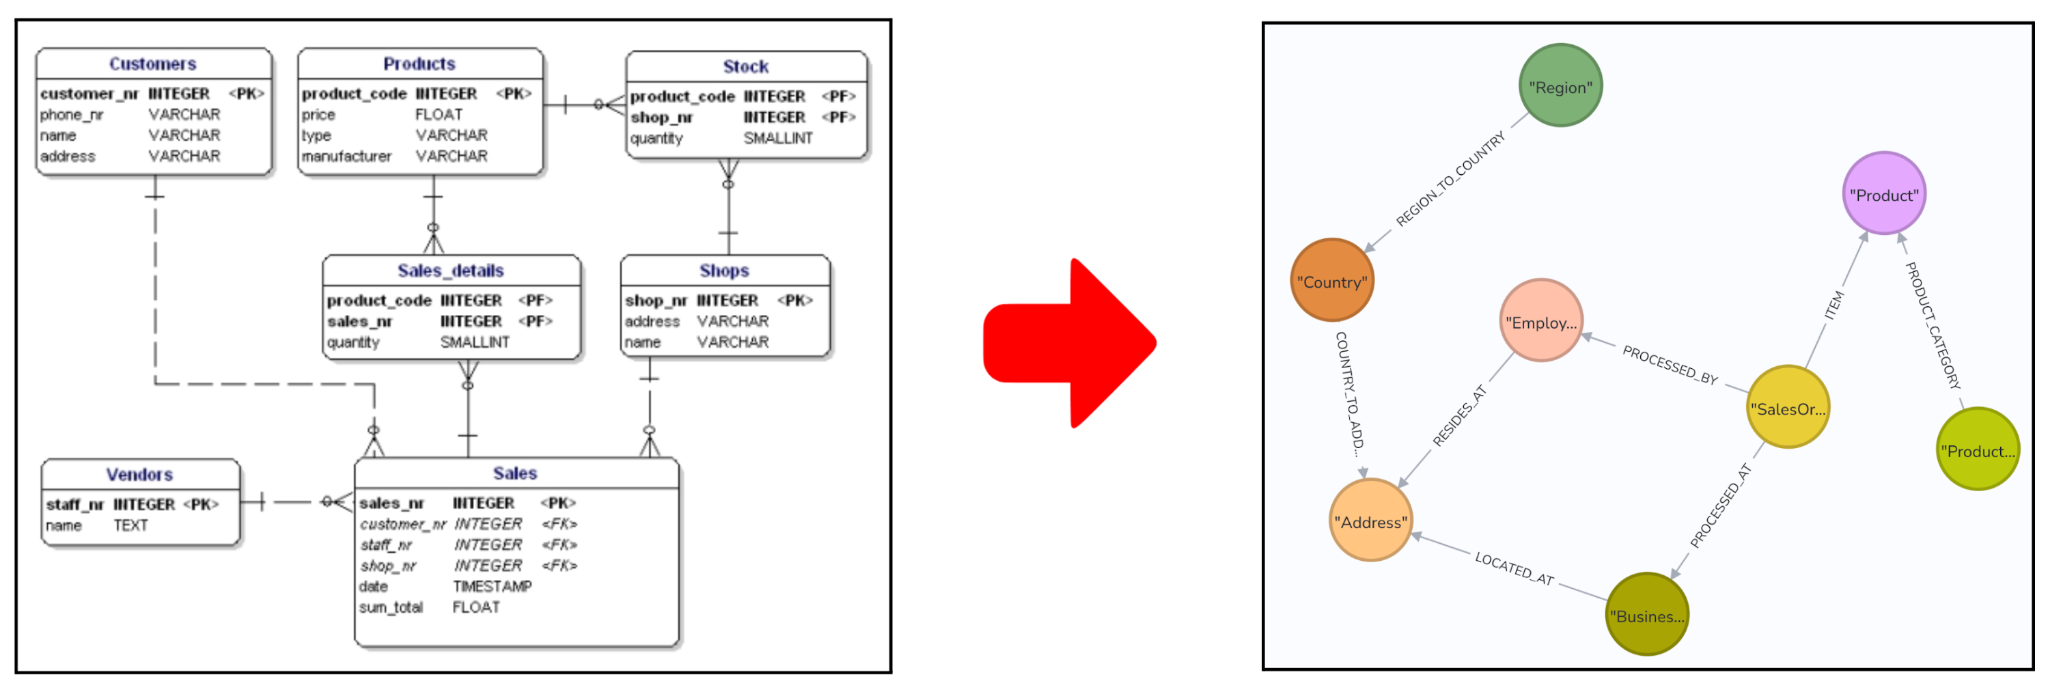
Figure 1. Relational database model to Graph Data model
How to Get Started With Neo4j?
Once we understand the SAP data model, the next step is to determine what data elements are worth loading into the Neo4j graph database.
Neo4j consists of three components:
- Neo4j Graph Database: The leading graph database
- Neo4j Graph Data Science: A collection of 50+ algorithms that operate on graphs
- Neo4j Bloom: A business intelligence tool designed specifically for understanding graphs
Neo4j can be used as a fully managed service called Neo4j Aura. Alternatively, it can be deployed on IaaS and self-managed. Listings for both options are available in the leading cloud marketplaces:
In this example, we’re going to use Neo4j AuraDB Professional, deployed from the Google Cloud Marketplace. Figure 2 below shows the Neo4j console. From there we can deploy Neo4j AuraDB.
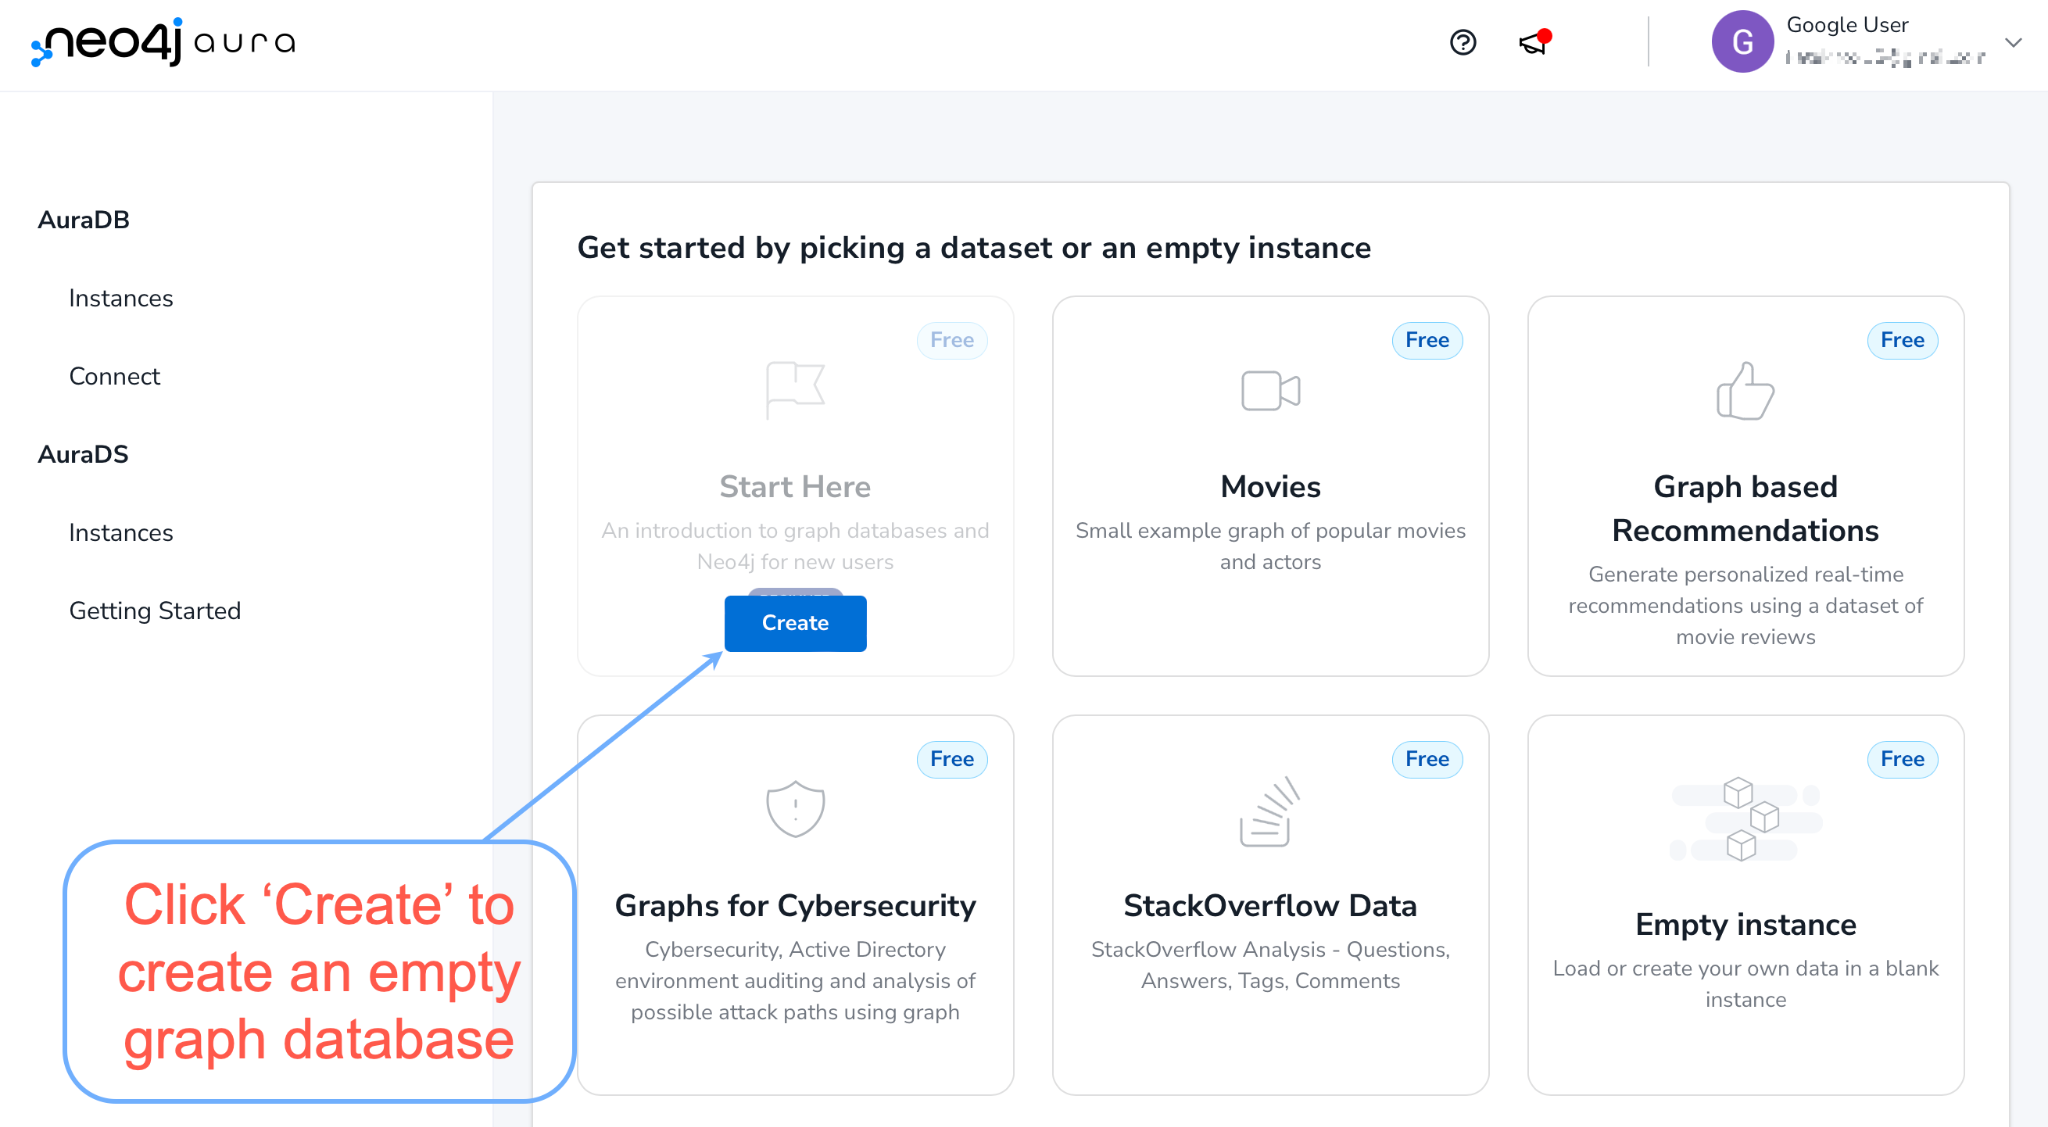
Figure 2: Getting started with AuraDB

Figure 3: Save the credentials

Figure 4: Open the instance
It takes a couple of minutes to create an instance. Once it’s ready, the Open button will be enabled and you can load the SAP sample data.
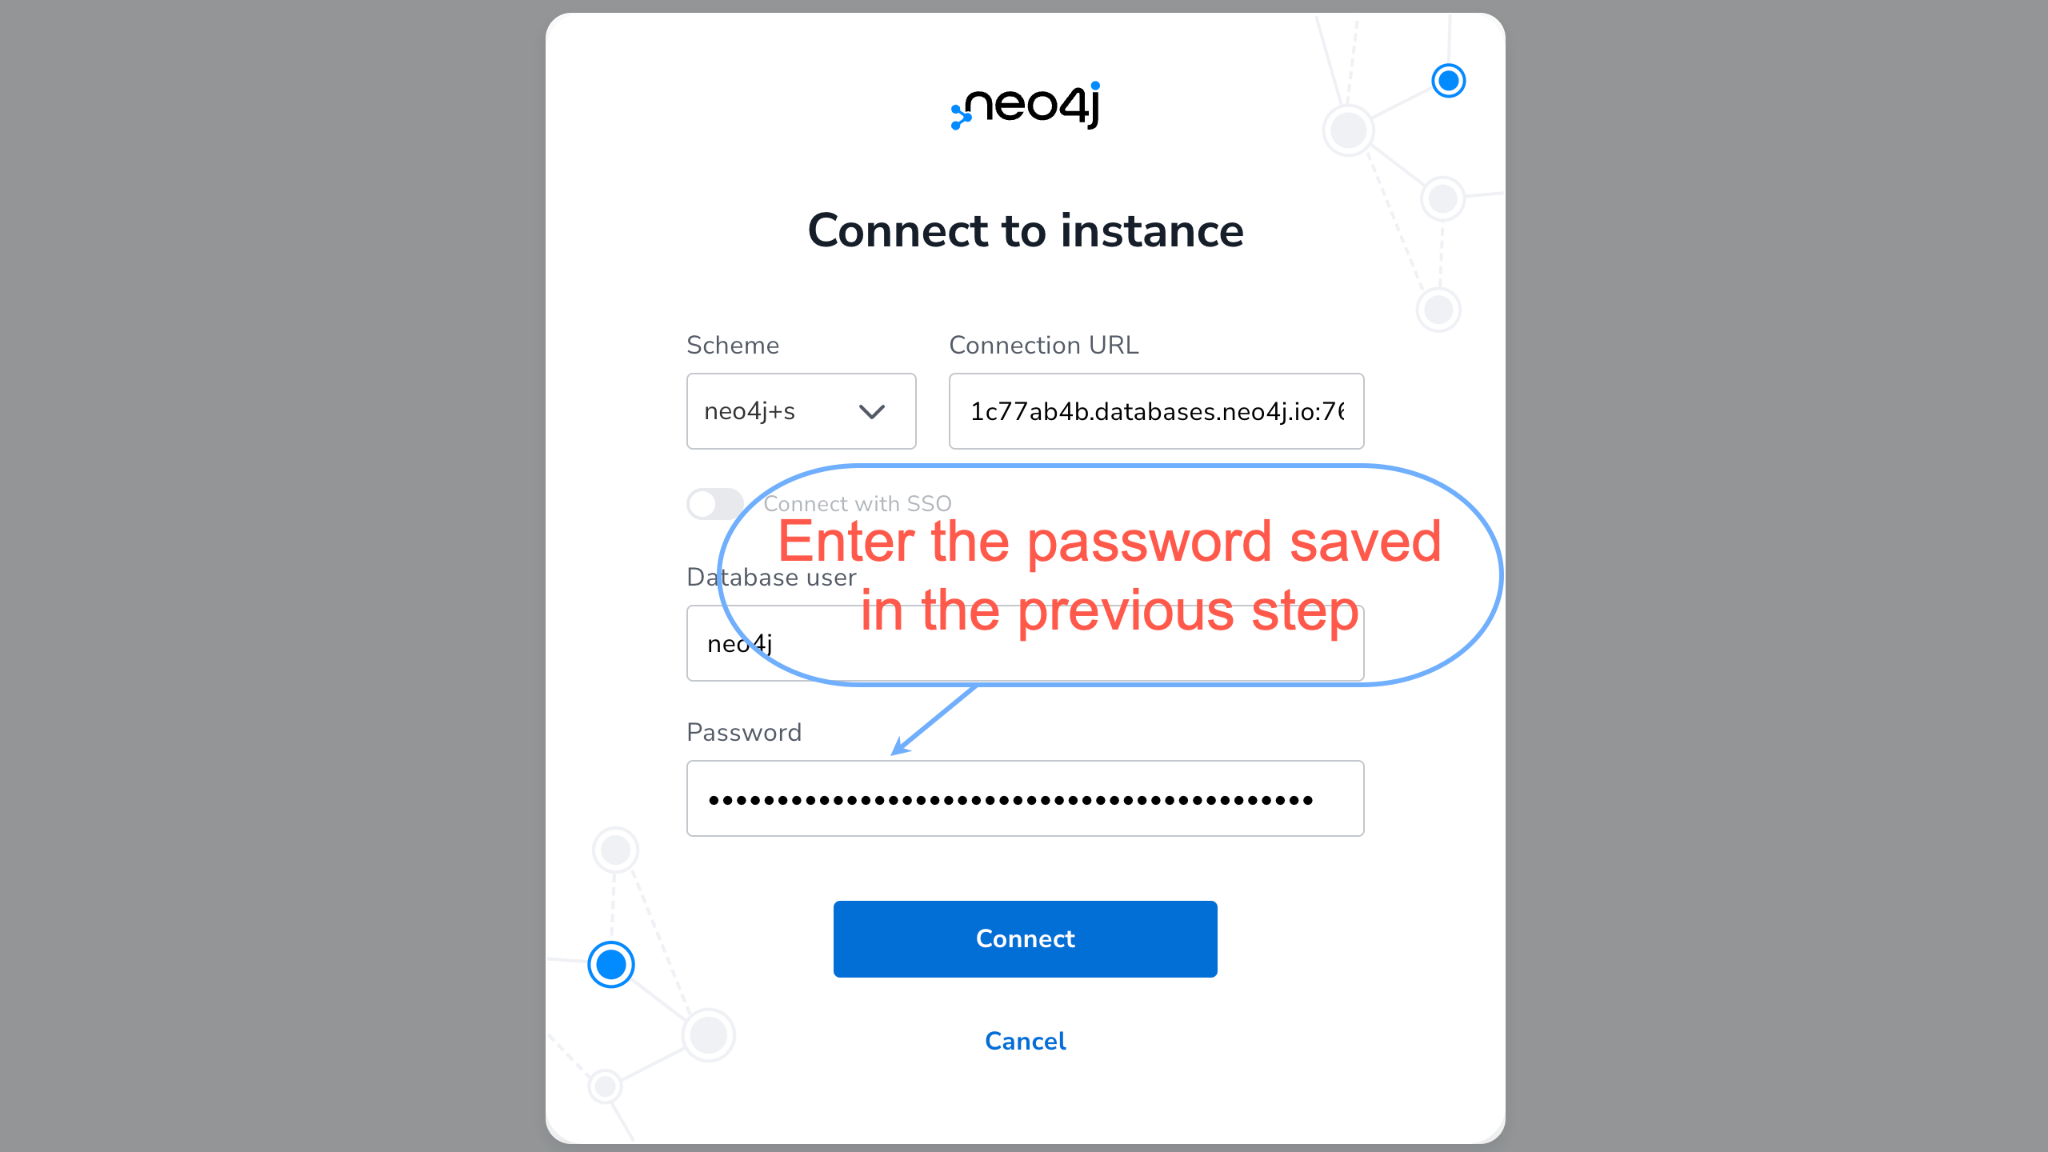
Figure 5: Connect to the Instance
Load
All the necessary Cypher queries to load the SAP sample data are available in our Neo4j Partner repository in Github. This GitHub repository is officially maintained by Neo4j for Neo4j Partners and contains all the integrations between Neo4j and our ecosystem partners. For this exercise, I created all the necessary Cypher queries to load the SAP sample data into your Neo4j instance. You can click here and copy all the Cypher queries from the GitHub page.
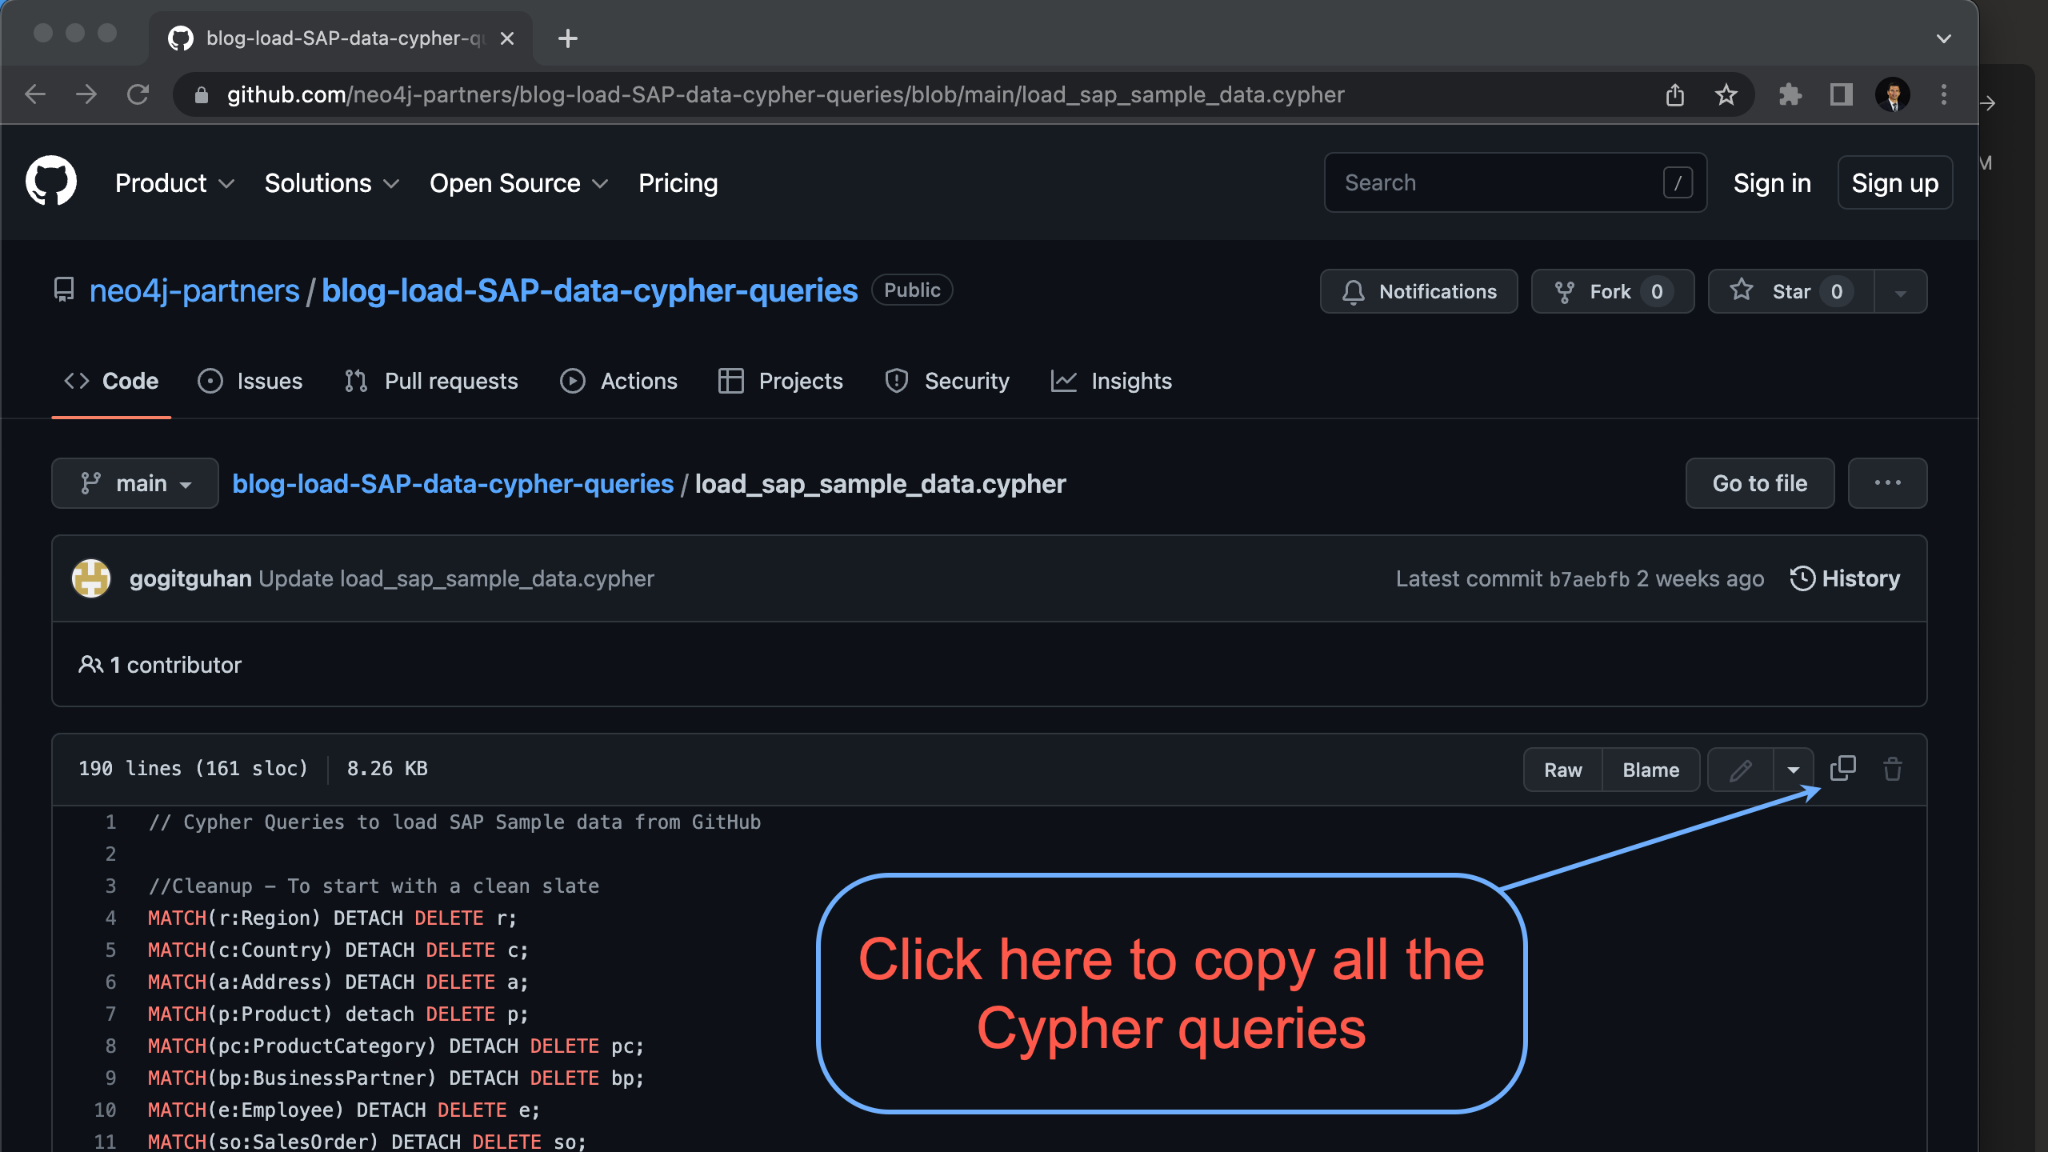
Figure 6: Copy Cypher queries from the neo4j-partner repository.

Figure 7: Run the Cypher queries from GitHub to load the SAP sample data
Explore
Once the Cypher queries are run and the SAP sample data is loaded successfully, we can start analyzing the data. Now, let’s look at the SAP sample data in Neo4j Bloom. With Neo4j Bloom, you can immerse yourself in the data through the power of visualization. Let’s start with an employee – look at all the sales orders processed by that employee and look at the products in each sales order in just a few clicks.
Open the “Explore” tab and create a new perspective.

Figure 8: Creating a new General Perspective

Figure 9: Finding an employee named “William”
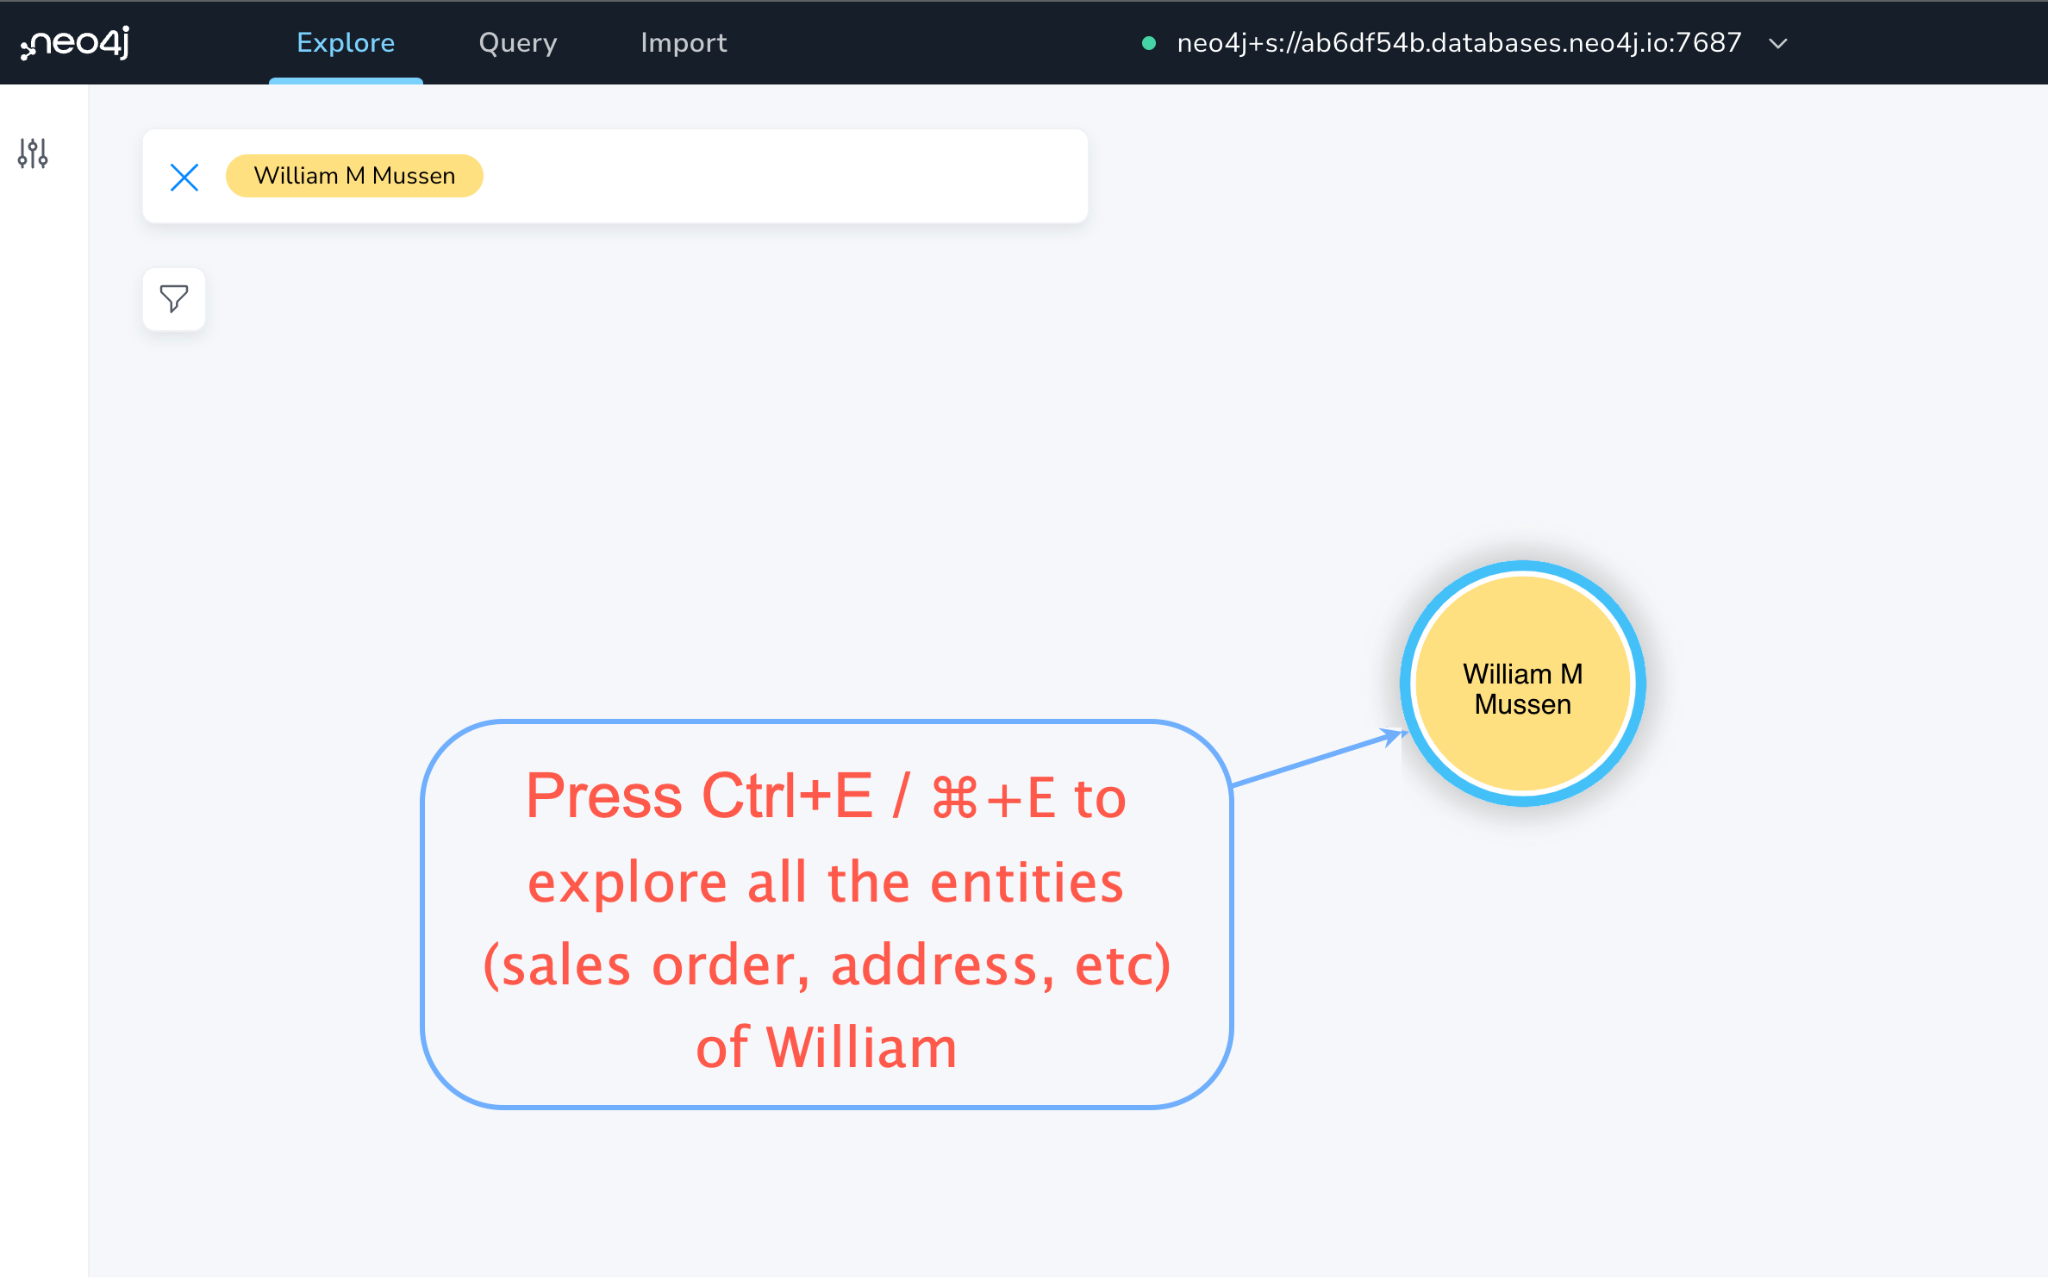
Figure 10: Explore all the related entities of William
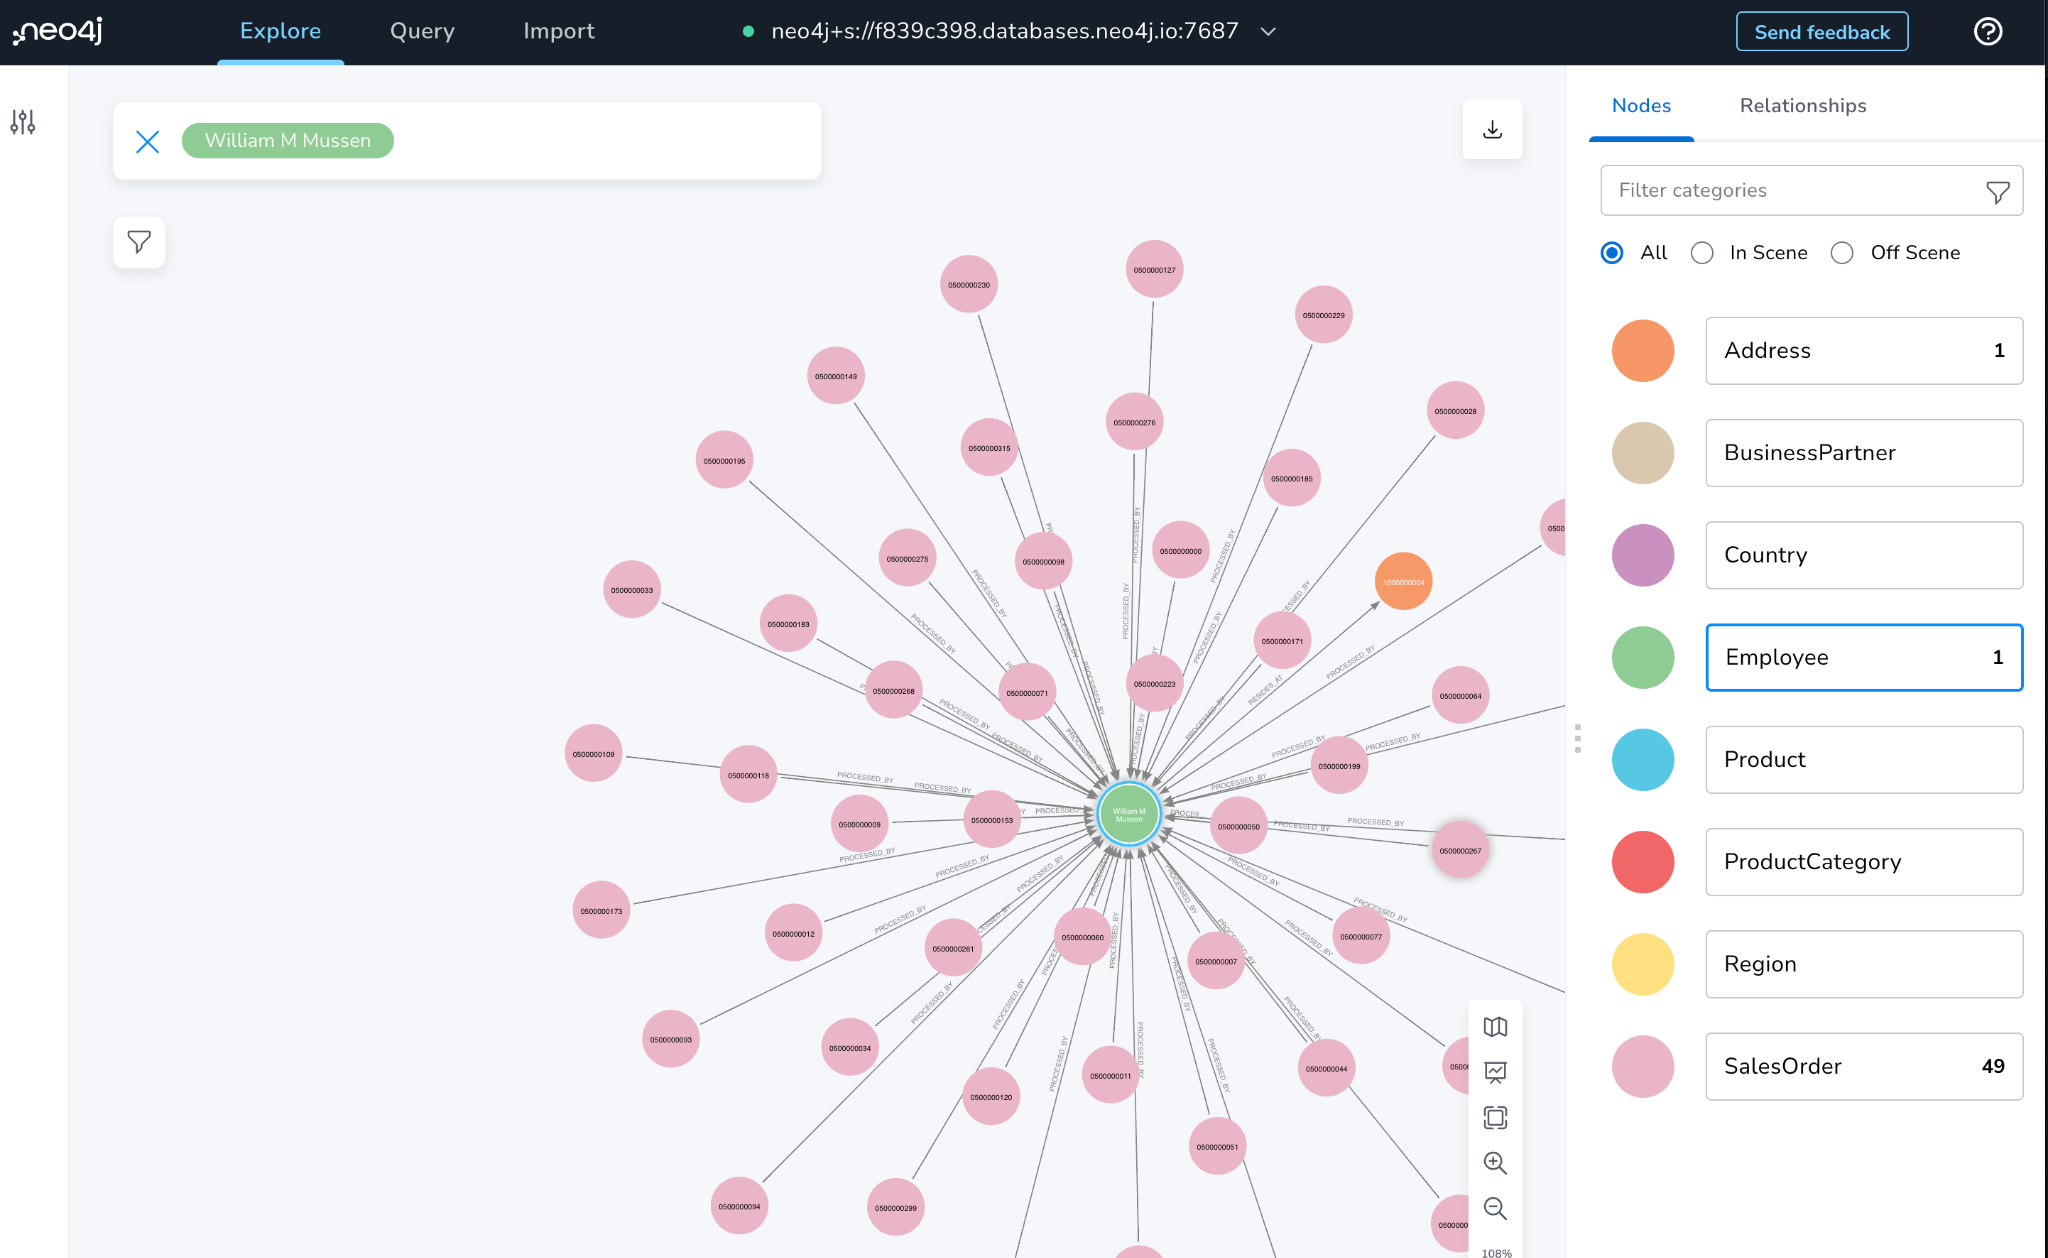
Figure 11: Exploring all the related nodes of William (49 sales orders and one address)
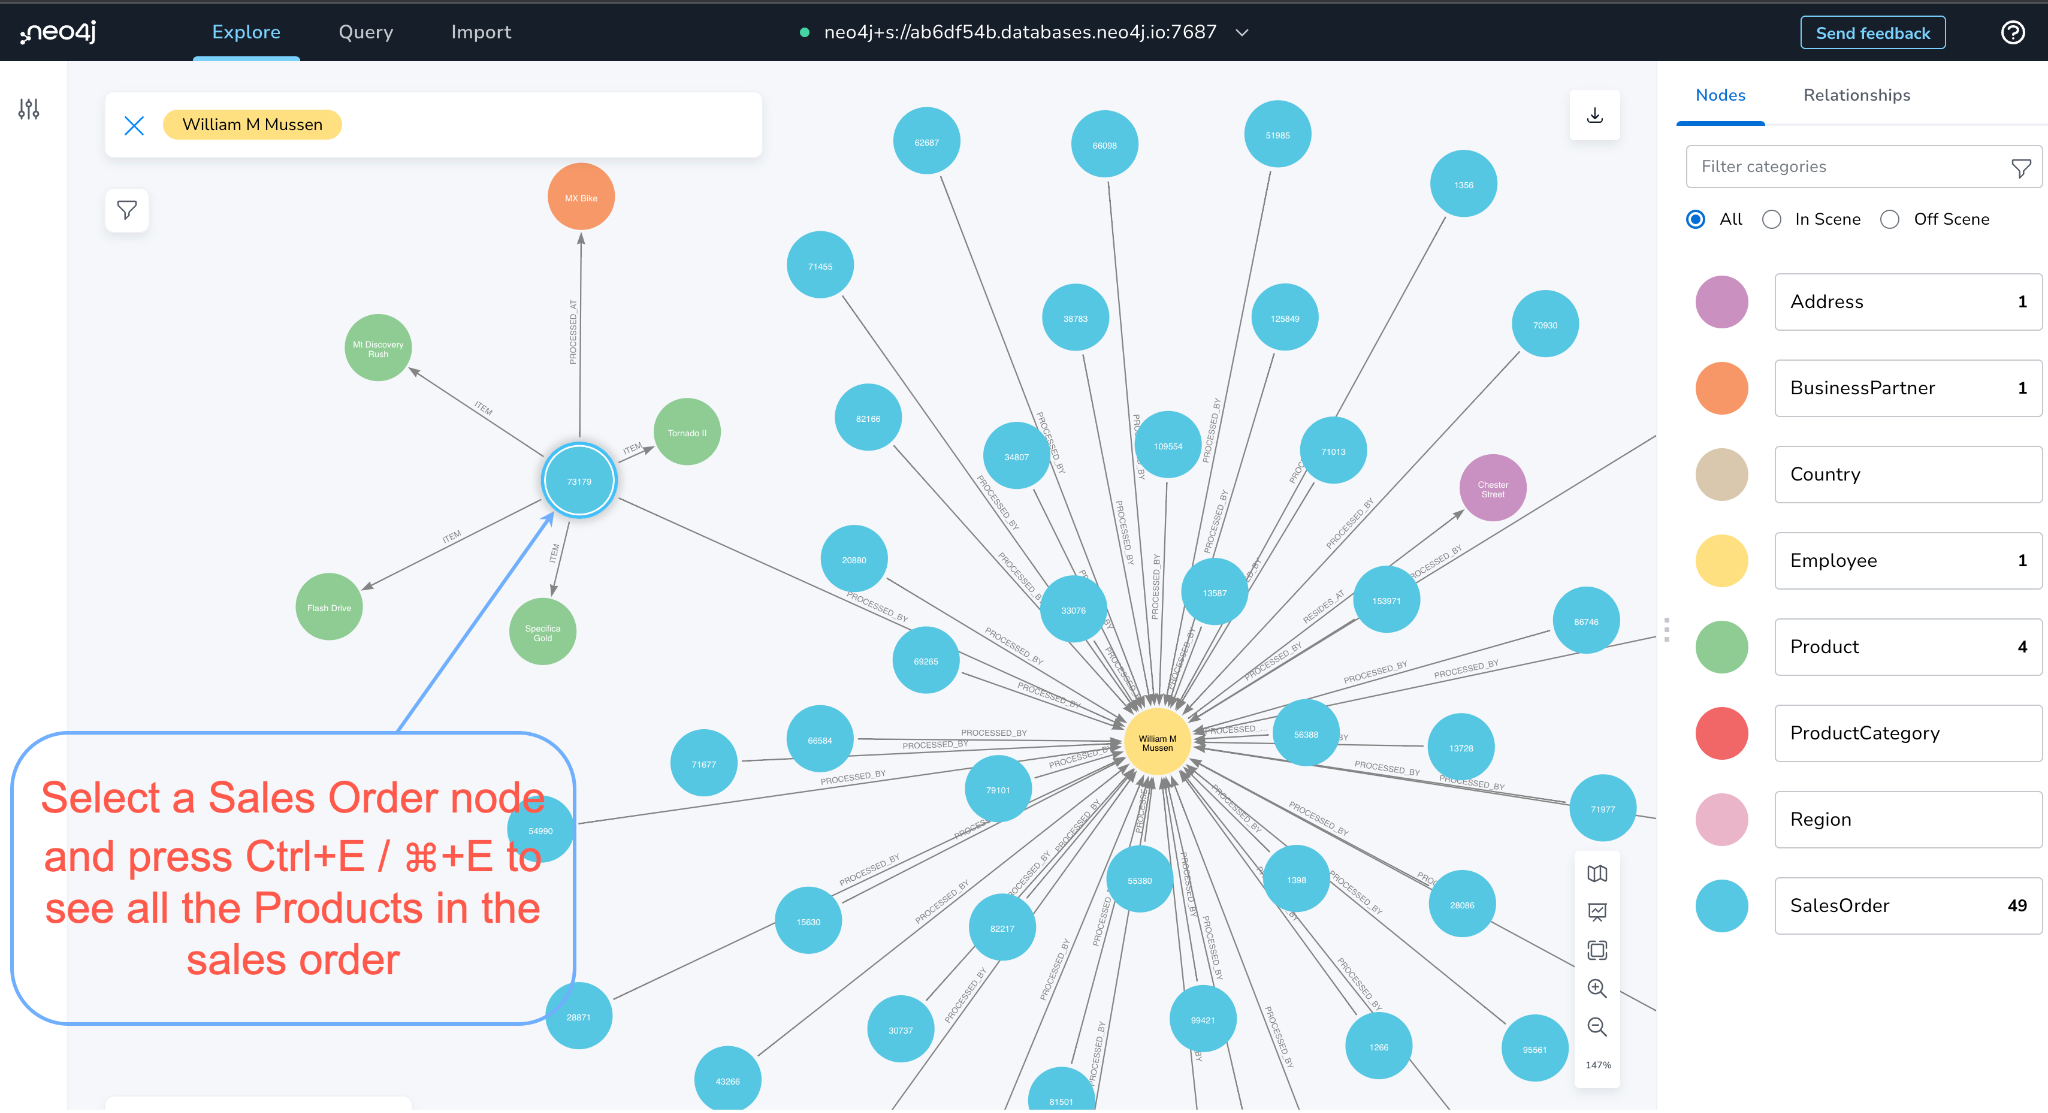
Figure 12: Exploring all the products in a sales order processed by William
Analyze
Now, we can analyze the sales data to find the top business partners, best-selling bikes, best-performing employees, etc. Here are some sample graph data analysis queries. You can copy these Cypher queries and run them in the Neo4j browser.
1. Top Business Partners:
MATCH (so:SalesOrder)-[:PROCESSED_AT]->(bp:BusinessPartner)
RETURN bp.company_name as Business_Partner_Name, sum(so.gross_amount) as `Total_Sales_By_Emp (USD)`
ORDER BY `Total_Sales_By_Emp (USD)` DESC LIMIT 10;
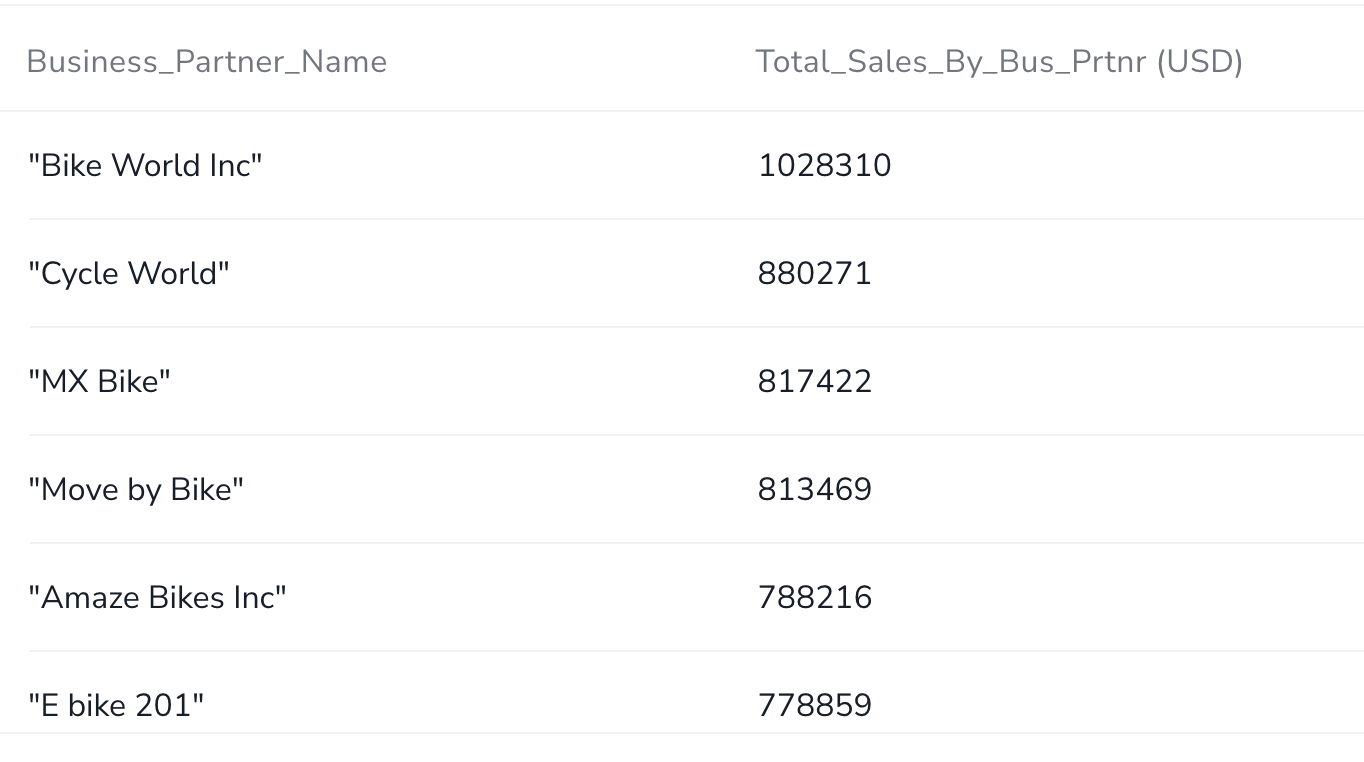
Figure 13: Top business partners
2. Top Performing Employees:
MATCH (so:SalesOrder)-[:PROCESSED_BY]->(e:Employee)
RETURN e.name as Emp_Name, sum(so.gross_amount) as `Total_Sales_By_Emp (USD)`
ORDER BY `Total_Sales_By_Emp (USD)` DESC LIMIT 10;
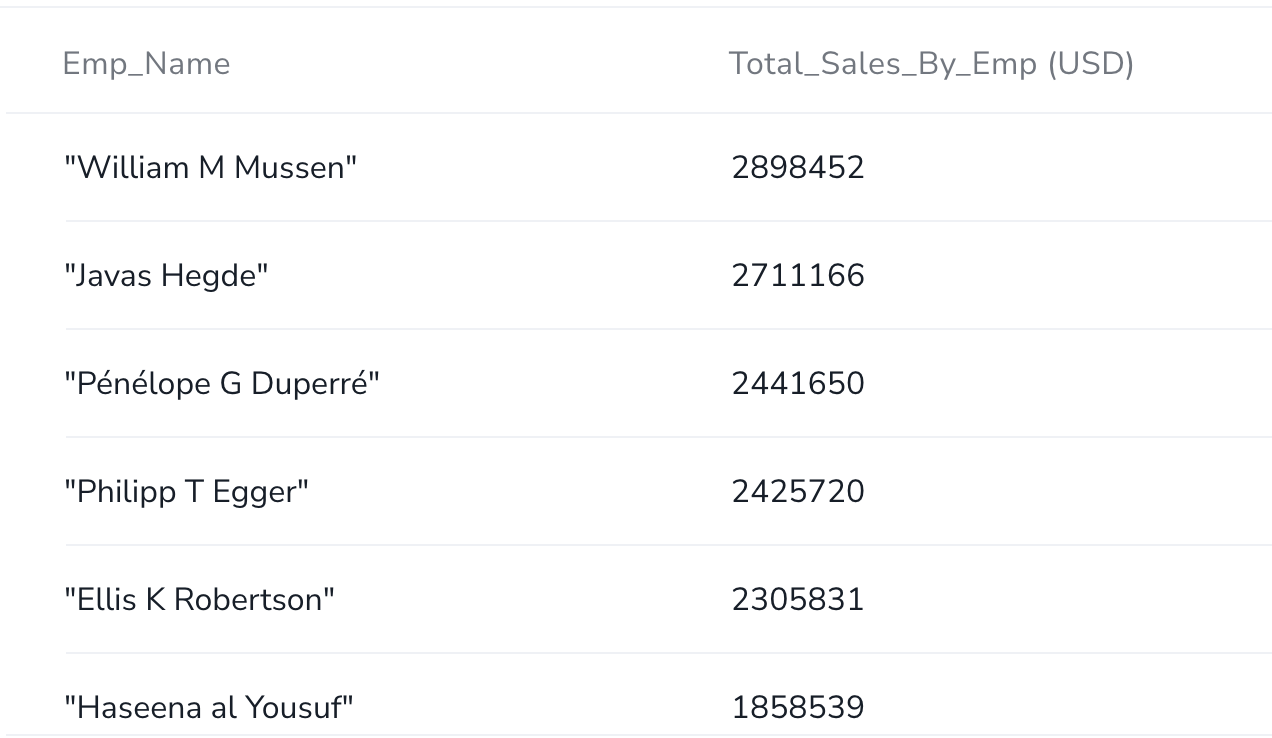
Figure 14: Bike sales data analysis – Best performing employees
3. Sales by Region:
MATCH (so:SalesOrder)
RETURN so.sales_org as Region, sum(so.gross_amount) as `Total_Regional_Sales (USD)`
ORDER BY `Total_Regional_Sales (USD)` DESC LIMIT 10;
4. Sales By Country:
MATCH (so:SalesOrder)-[:PROCESSED_AT]->(bp:BusinessPartner)-[:LOCATED_AT]->(a:Address)<-[:COUNTRY_TO_ADDRESS]-(c:Country)
RETURN c.name as Country, sum(so.gross_amount) as `Total_Sales_By_Country (USD)`
ORDER BY `Total_Sales_By_Country (USD)` Desc LIMIT 5;
5. Top 10 Products:
MATCH (so:SalesOrder)-[i:ITEM]->(p:Product)
RETURN p.name as Product, sum(i.quantity) as Quantity
ORDER BY Quantity Desc LIMIT 10;
6. Top 5 Product Category:
MATCH (so:SalesOrder)-[i:ITEM]->(p:Product)<-[:PRODUCT_CATEGORY]-(pc:ProductCategory)
RETURN pc.name as Product_Category, sum(i.quantity) as Quantity
ORDER BY Quantity Desc LIMIT 5;
Wrapping Up
We just saw how easy it is to load data from the SAP into Neo4j to analyze and explore the sales dataset. In the analysis section, we were able to identify the top-selling products, best-performing employees, etc. In the Explore section, using Neo4j’s data exploration tool Bloom, we were able to visualize data and it allowed us to navigate and query the data without any query language or programming.
With this sales data in Neo4j graph, businesses can better understand their important product lines, their related business partners, and their locations, thereby helping businesses to optimize their supply chain and provide better customer service.
You can take it further to apply AI/ML algorithms in Neo4j Graph Data Science to solve complex use cases like fraud detection and analytics, a 360-view of customers, corporate identity and asset management, supply chain management, and a business knowledge graph.
It’s easy to get started with Neo4j by using your preferred cloud providers’ marketplace:
Please reach out to me. if you anticipate any challenges with your environment or to learn more about how other customers have implemented similar solutions into practice.
Share Article


Explore
Related Articles


What Are the Different Types of Graph Algorithms & When to Use Them?


