Financial Fraud Detection with Graph Data Science: Analytics and Feature Engineering

Graph Analytics & AI Program Director
6 min read

Financial fraud is growing and it is a costly problem, estimated at 6% of the Global Domestic Product, more than $5 trillion in 2019.
Despite using increasingly sophisticated fraud detection tools – often tapping into AI and machine learning – businesses lose more and more money to fraudulent schemes every year. Graph data science helps turn this pattern around.
By augmenting existing analytics and machine learning pipelines, a graph data science approach increases the accuracy and viability of existing fraud detection methods. The end result: Fewer fraudulent transactions and safer revenue streams.
In this blog series, we are taking a closer look at how your data science and fraud investigation teams can tap into the power of graph technology for detecting first-party fraud as well as sophisticated fraud rings.
In this second blog of our four-part series, we discuss ways to use graph data science for fighting fraud.
In blogs three and four, we will dive into improving fraud detection with graph feature engineering, and reveal several ways to identify fraud rings.
Three Ways to Use Graph Data Science
To analyze the network structures in your data, load a copy of it into a graph database like Neo4j. You need data in a graph structure before you learn from the topology of your data and its inherent connections.
Here are three ways to use graph data science to find more fraud:
- First, with data connected in a graph database, you search the graph and query it to explore relationships.
- Second, you continue to query but also use graph algorithms to get a sense of the structure of your data and discover patterns and anomalies.
- Third, you use the results of those algorithms to find features that are most predictive of fraud to add them to your existing machine learning models.
Now let’s explore these three ways in more detail.
Graph Search & Queries for Exploration of Relationships
With connected data in a graph database, the first way is searching the graph and querying it to explore the relationships.
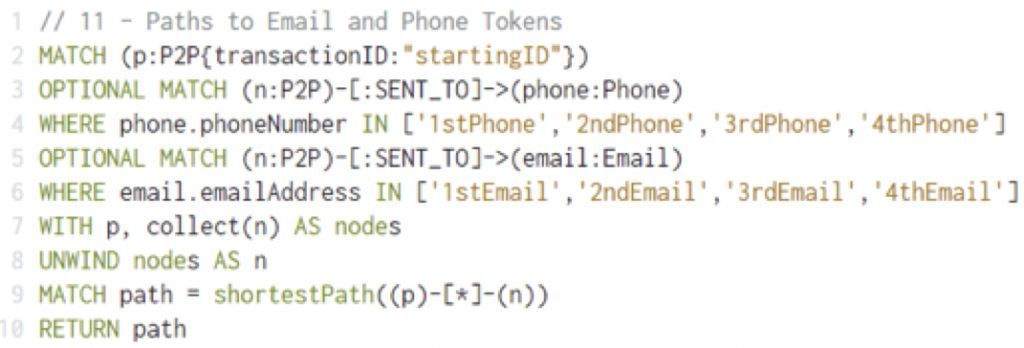
Domain experts might write a query to identify, for example, account holders with the same phone number, the same IP address or the same mailing address. A few lines in the Cypher query language replace many lines of complex SQL code. Consider the sample Cypher query below that returns the shortest path from a start node to a close group of email or phone numbers. This query is a jumping-off point for several other analyses. If the starting node is fraudulent, nearby nodes may also be fraud or targets of fraud.
 Neo4j Bloom enables you to visually explore graph datasets, to query data using code-free and pre-configured searches and to share visual
perspectives with other teams.
Graph Analytics for Discovery
The second way to use graph data science is by querying the graph and using graph algorithms to further investigate your data, get a sense of its structure and discover patterns and anomalies.
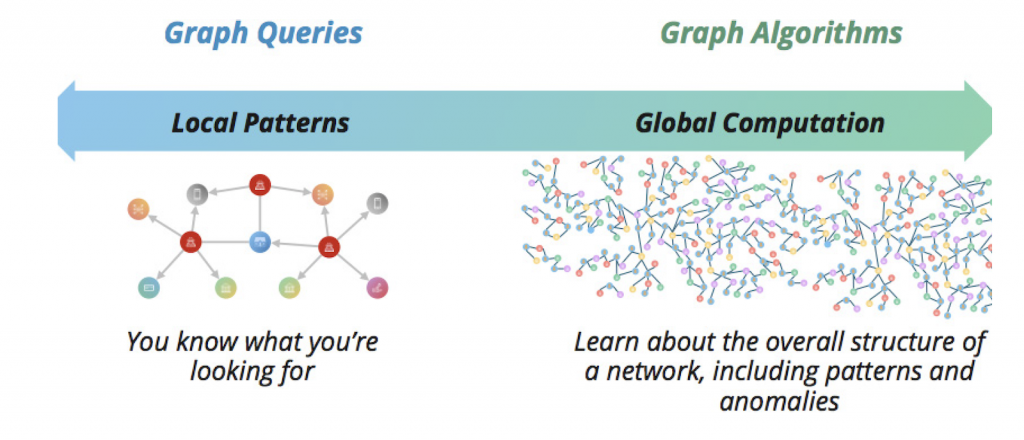
When you know what you’re trying to find – such as identifying people are in a known fraudster’s extended network – a graph query works well. However, when you know the general structure you’re looking for but not the exact pattern, consider using a graph algorithm.
A graph algorithm is code specifically written to perform a certain type of sophisticated analysis, usually looking at a graph dataset as a whole.
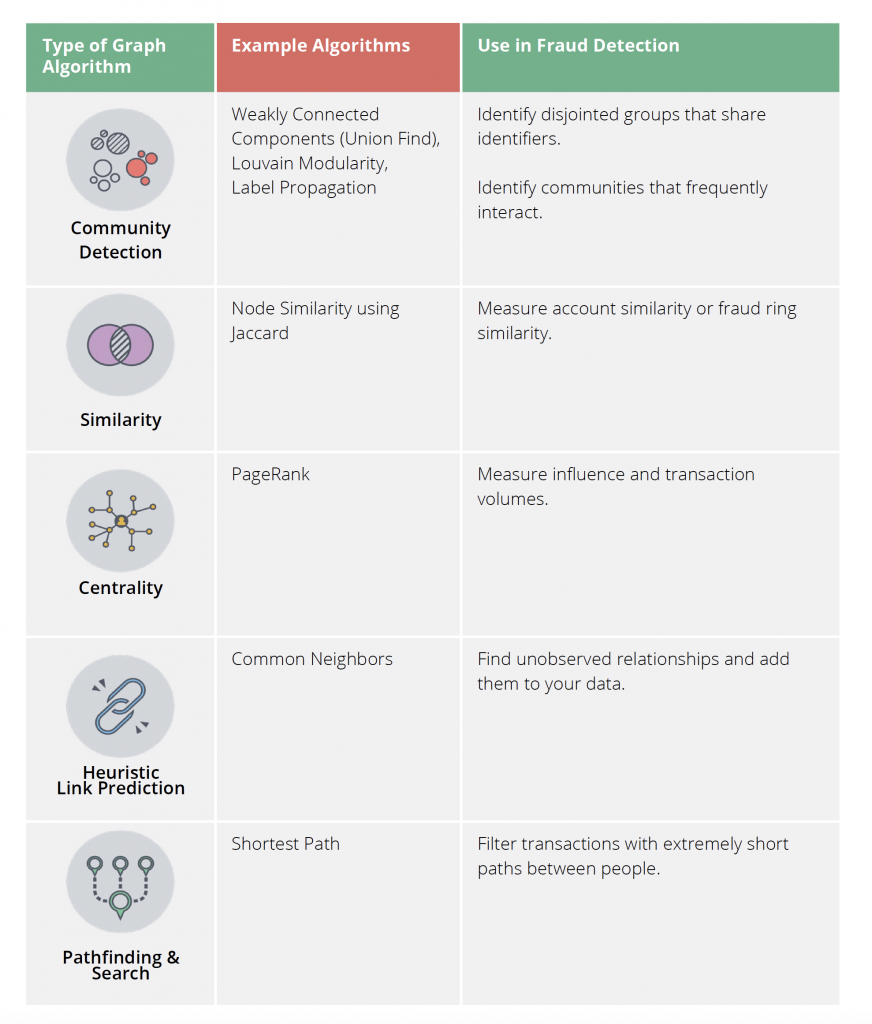
After running a community detection algorithm, for example, a data scientist might hand off the results to an analyst to investigate whether the strong connections among account holders indicate a fraud ring, another fraud pattern or something else entirely, such as customer loyalty within a particular geography.
Neo4j Graph Data Science Library includes enterprise scalable graph algorithms
optimized to run against connected data in Neo4j. This library offers an enterprise-grade method for data scientists and analysts to run graph algorithms against connected data at scale.
Graph Feature Engineering
The third way to use graph data science is through graph feature engineering.
Using graph algorithms and queries, data scientists find features that are most predictive of fraud to add to their machine learning models. For example, after using a community detection algorithm to find anomalies of tight communities that investigators have confirmed characterize fraud rings, we can then extract the relevant graph features of the full dataset into a classifier model to significantly increase predictive accuracy of existing fraud detection strategies.
The flexibility, scale and ease of use of the Neo4j’s Graph Data Science Library allow data scientists to quickly experiment with multiple approaches to validate the most predictive features, before moving a model into production.
Graph features can be as simple as a node’s community ID or a centrality metric, or may include more complex statistics describing the characteristics of a given community, proximity to known fraudulent accounts, similar relationship patterns to previously labeled fraud, or any other descriptive network attribute. Features can be saved as a node or relationship property, or can be streamed directly into another model development environment. As the graph is updated, algorithms can be rerun as needed while still leveraging the previously seeded results, to continuously retrain the graph-based model with maximum consistency and computational efficiency.
By leveraging graph features together with existing ML models and approaches, data scientists leverage the predictive power of network structure and relationships at scale without having to change validated and well-understood approaches.
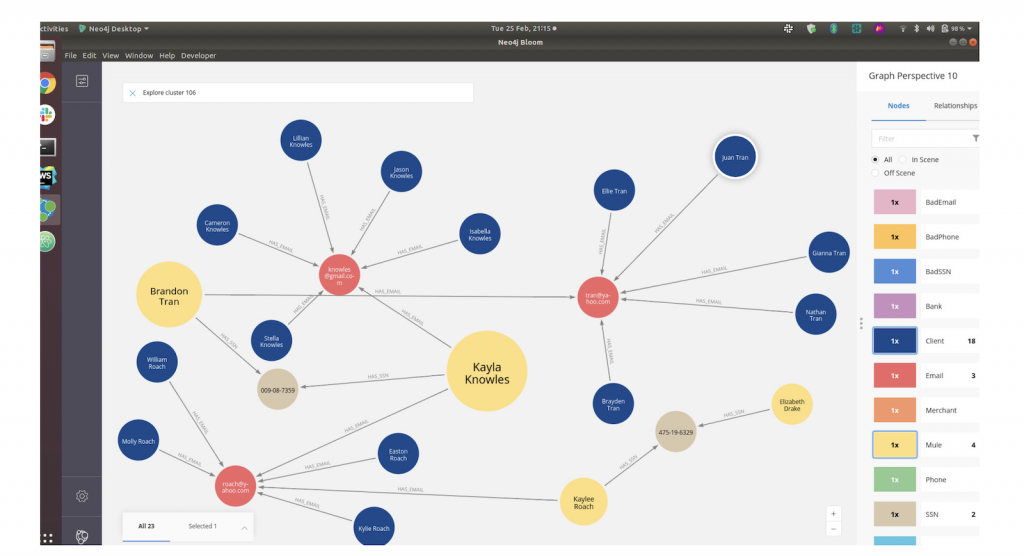
We can demonstrate how topology can be predictive using a variation on the PaySim synthetic mobile transfer dataset. The following screenshot from Neo4j Bloom shows the results after running a community detection algorithm to find unusual islands of activity. We then use Betweenness Centrality to score the amount of influence each node has. In the visualization, the node size corresponds to the Betweenness Centrality score.
In this screenshot, we see a “suspicious” cluster (people sharing emails/phones/ identifiers). A person with high betweenness centrality (large yellow) is more likely to be a mule.
Visually exploring graphs helps analysts intuit what to investigate as well as what elements might be predictive. This type of structural information can be used for feature engineering and extracted to a table format for machine learning to predict whether someone is a fraudster. This is shown in the following table with a sample of clients, their betweenness centrality score, the number of identifiers they share with others, a weighted score based on what is being shared and then finally the prediction of whether they are a fraudster.
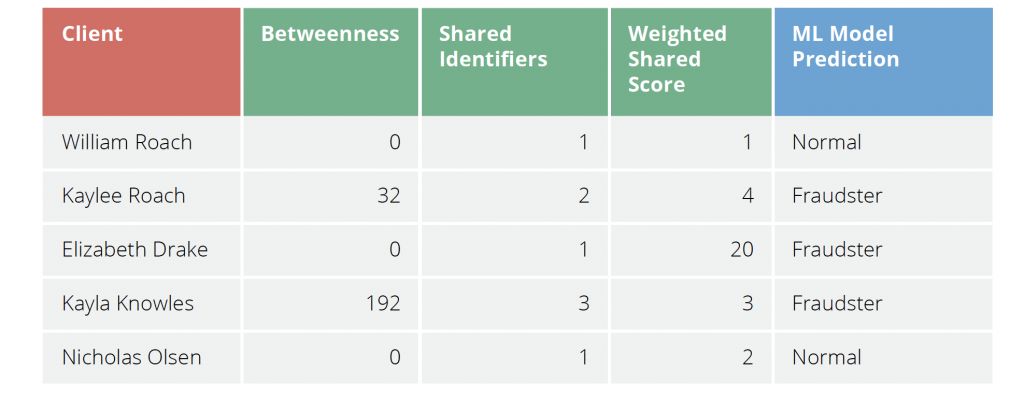
In the table, we see that William Roach shares an email address with several apparent family members, which is not very suspicious. Kaylee Roach is highly connected and shares multiple elements with others, so the model predicts she is a fraudster. Elizabeth Drake shares a social security number with Kaylee, and that red flag alone is enough to predict that she may be a fraudster.
Note that Nicholas Olson is not shown in the screenshot because of course a real network analysis would encompass far more clients than we see in this view.
Conclusion
As we have shown in this second blog in our four-part series on fraud detection with graph data science, there are numerous ways to use graph data science to detect fraud rings. Graph data science uses network structure to identify fraud in connected data.
Next week, in blog three of this series, we will highlight how to improve fraud detection with graph feature engineering.
Discover how organizations are adding graph data science to their machine learning pipelines to find more fraud. Click below to get your copy of Financial Fraud Detection with Graph Data Science.
Share Article


Explore
Related Articles
Fraud rings hide in the connections: Graph-Enriched Detection for Databricks Genie with Neo4j

SumoDB in Neo4j: Chaining Multiple Graph Algorithms in Snowflake — Part 3

APRA just put the financial sector on notice over AI. Government agencies need to take notes.


