Financial Fraud Detection with Graph Data Science: Augment Your Approach

Graph Analytics & AI Program Director
5 min read
Financial fraud is growing and it is a costly problem, estimated at 6% of the Global Domestic Product, more than $5 trillion in 2019.
Despite using increasingly sophisticated fraud detection tools – often tapping into AI and machine learning – businesses lose more and more money to fraudulent schemes every year. Graph data science helps turn this pattern around.
By augmenting existing analytics and machine learning pipelines, a graph data science approach increases the accuracy and viability of existing fraud detection methods. The end result: Fewer fraudulent transactions and safer revenue streams.
In this blog series, we’ll take a closer look at how your data science and fraud investigation teams can tap into the power of graph technology for detecting first-party fraud as well as sophisticated fraud rings.
In this first blog of our four-part series, we scope the problem, discuss current tactics and describe how graph data science augments them.
In subsequent blogs, we will dive into graph algorithms and examples of applying graph data science to uncover first-party fraud as well as fraud rings.
The Challenge of Detecting Financial Fraud
Stemming the wave of financial loss requires constant vigilance since fraud perpetrators continue to evolve their tactics, allowing them to evade detection.
Take for example one of the fastest-growing types of fraud in the U.S. – synthetic identity theft. Fraudsters meld various false and authentic elements (such as addresses, phone numbers, emails, employers and more) into a synthetic identity, which they then use for fraudulent purposes. Synthetic identities pass as real identities all too frequently. Traditional fraud models that consistently flag other types of high-risk identities miss 85% of synthetic identities according to ID Analytics.
At the same time, fraud rings – both small and large – are on the rise. With multiple parties involved in fraud, the associated loss skyrockets. In its 2018 Report to the Nations, the Association of Certified Fraud Examiners (ACFE) found a direct correlation between the number of participants and the cost of a fraud incident, rising from an average of $74,000 for one perpetrator to $339,000 for three or more perpetrators. Like pack hunters,
fraudsters are a greater threat when they work together.
The question becomes how to reduce losses from fraud given these challenges.
Why Current Tactics Fail to Identify All Fraud
Data scientists have developed rigorous machine learning (ML) and analytics models to detect fraud. However, most data science models omit something critically important: network structure.
Research on social network analysis highlights the predictive power of analyzing network structure. As James Fowler says in his book, Connected, “Increasingly we’re learning that you can make better predictions about people by getting all the information from their friends and their friends’ friends than you can from the information you have about the person themselves.”
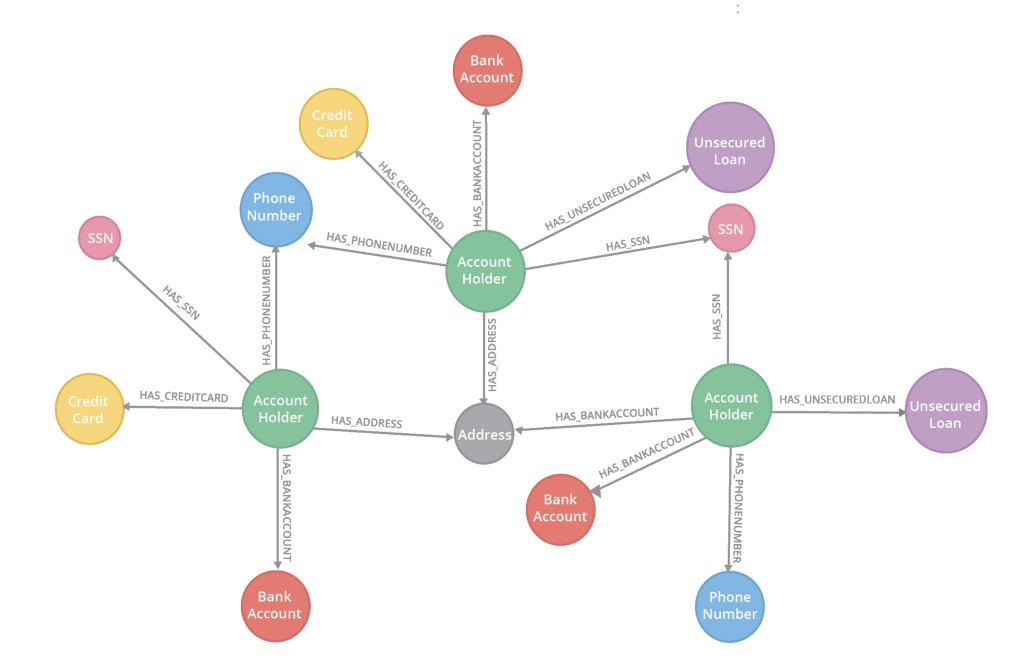
Network analysis captures the inherent relationships between data elements. We are accustomed to thinking of social network data as a graph, but in fact, any type of data can be represented in this way. For example, it’s possible to visualize account holders and their information as a graph.
When you analyze the network structure of account holder information, you may see (as shown in the figure below) that multiple account holders have the same phone number or the same identification number. Sharing the same elements may indicate synthetic identity fraud. These types of fraud signals are difficult to uncover without an effective way to examine the vast network structure of thousands – or even millions – of account holders.
Tabular data models, with data organized in rows and columns, are not designed for capturing the complex relationships and network structure inherent in your data. Analyzing data as a graph enables you to reveal and use its structure for predictions, and with a graph database you can persist these connections for later analysis.
Enter Graph Data Science for Fraud Detection
Graph data science enables you to explore and analyze network structures using searches, queries and graph algorithms. Although graph data science draws upon graph theory, a subfield of discrete mathematics, you don’t need an academic background to benefit from it.
Graph data science improves the accuracy of fraud predictions. Because fraud is costly and the scale of the problem so large, financial services firms using graph data science report that even a fractional percentage increase in accuracy drives millions of dollars in savings. A large Neo4j customer in the financial services industry reported finding tens of millions of dollars in fraud in just the first few months of using Neo4j for graph data science.
Improved prediction accuracy derives from graph analytics and graph feature engineering. Once data is connected in a graph database, it is possible to engineer graph features derived from connection-related metrics such as the number of relationships going into or out of nodes or a count of potential triangles or neighbors in common. Community detection algorithms highlight groups in your data so you can investigate possible fraud rings and dig deeper into unusual patterns.
Augmenting your current models with graph data science unlocks network structures in your data.
With graph data science, you detect more fraud in the data you already have without changing your ML pipeline. By analyzing historical data in this way, you may uncover fraud that is still recoverable, adding top-line benefits. Once you find patterns indicative of fraud, incorporate them in real-time operational fraud detection systems to stem such losses in the future.
Conclusion
As we have shown in this first blog in our four-part series on fraud detection with graph data science, there are numerous challenges to detecting financial fraud, and current tactics often fail to find all the fraud lurking in your data. Graph data science uses network structure to identify fraud in connected data.
Next week, in blog 2 of this series, we will highlight several ways to use graph data science to detect financial fraud.
Fraud Detection Accelerated
Learn how graph databases strengthen your fraud detection solution and help you stay ahead of evolving threats.
Share Article


Explore
Related Articles

Why Machines Need Embeddings: Turning Graph Structure into Features

Finding Hidden Bottlenecks in Flight Networks with Aura Graph Analytics on Databricks

Find Impactful Graph-Powered Insights in Databricks

The Persistence Tax: Why It’s Time to Let Your Graph Analytics Sleep

Finding the Fastest Way Out: How Dijkstra’s Algorithm Finds Shortest Paths