How the Financial Services Industry Uses Graph Technology [Infographic]

Copywriter, Neo4j
1 min read

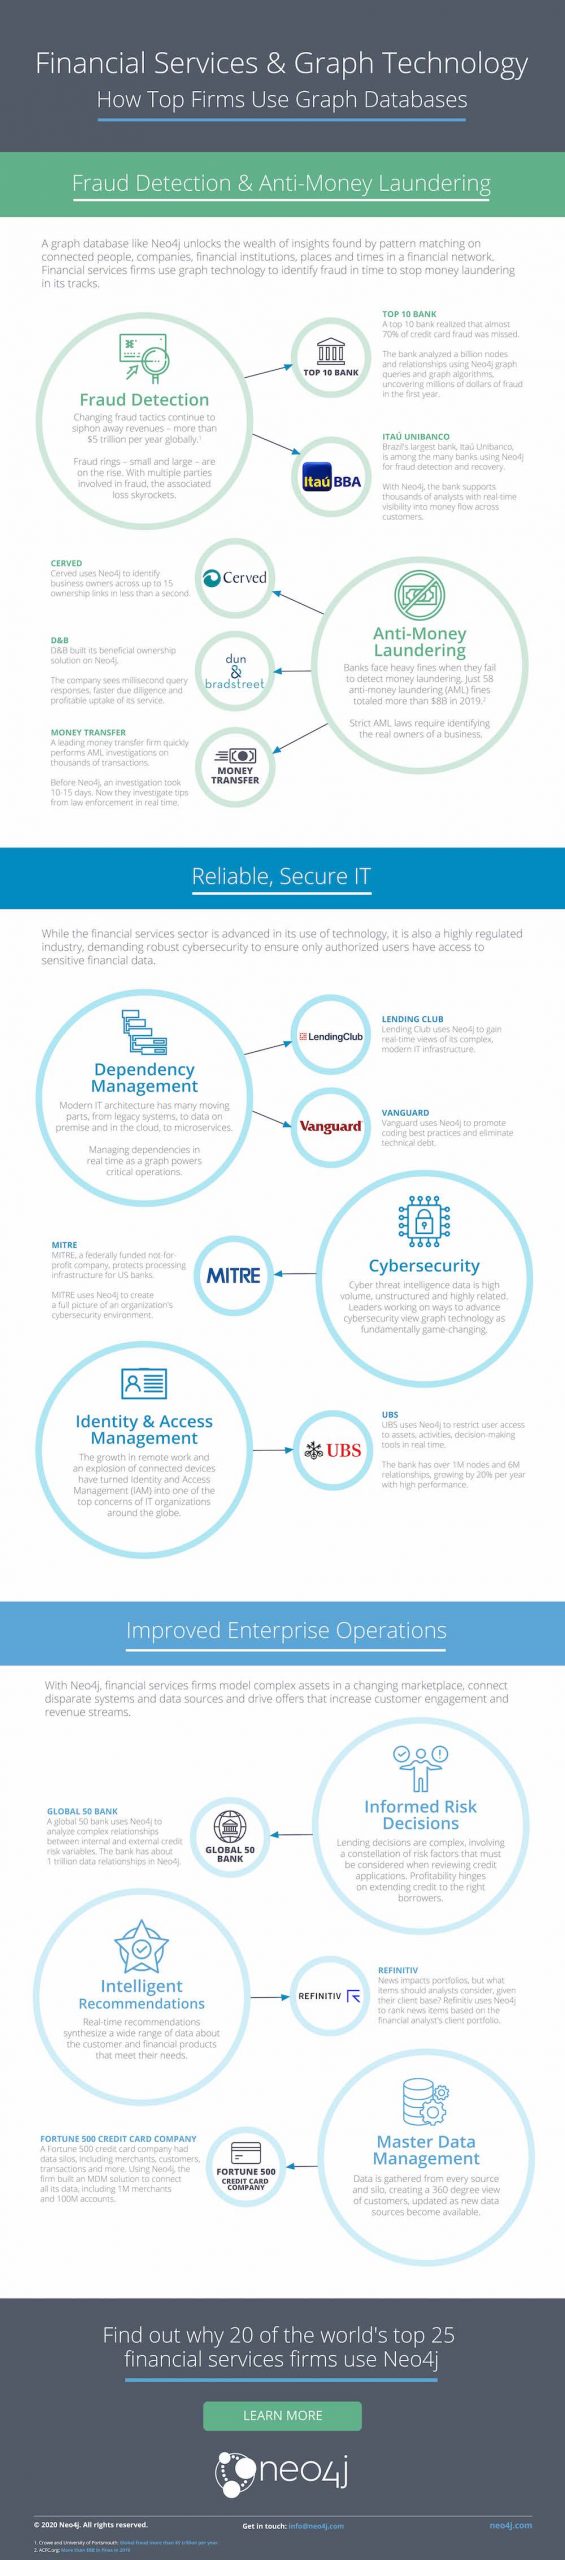
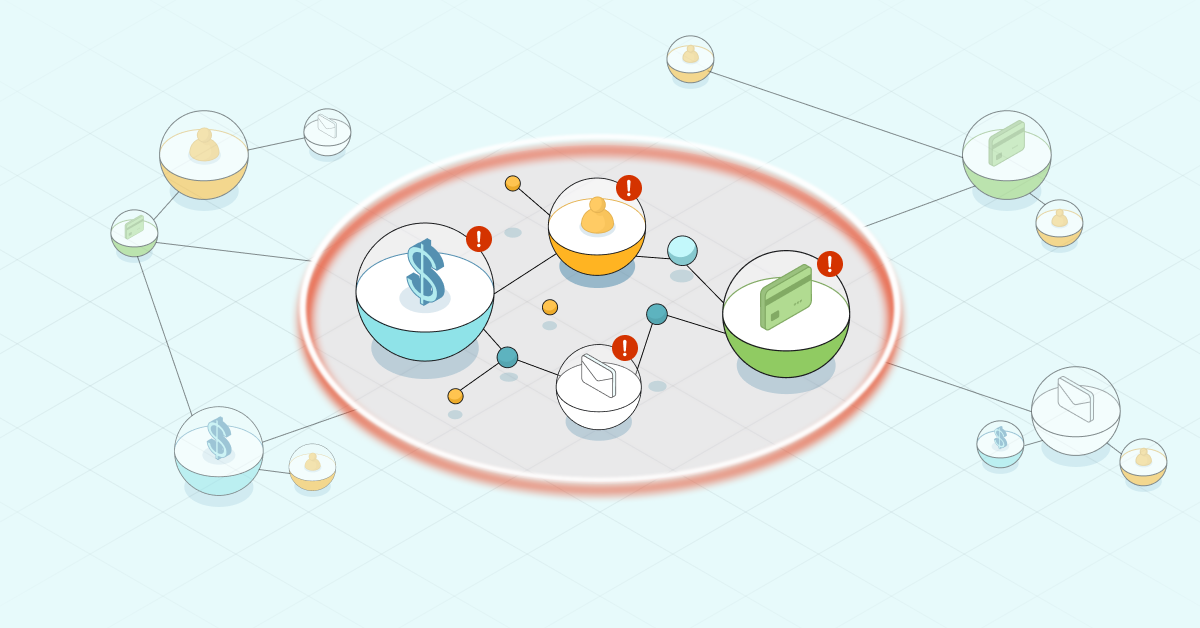
Fraud detection and anti-money laundering are top use cases for graph databases in the financial services industry. But it doesn’t stop there. Adoption of graph technology in one area often inspires use cases across the organization.
At financial firms large and small, graph technology plays a key role in cybersecurity, product development, risk management, and product recommendations.
Check out this insightful infographic to learn how the financial services industry uses graph technology:
Click infographic for high resolution image.
Share this infographic on Twitter!
Want to learn how financial services firms are using graph technology for fraud detection? Download this white paper Financial Fraud Detection with Graph Data Science for free now.
Share Article


Explore
Related Articles
Detect Fraud Faster With a Transaction Graph


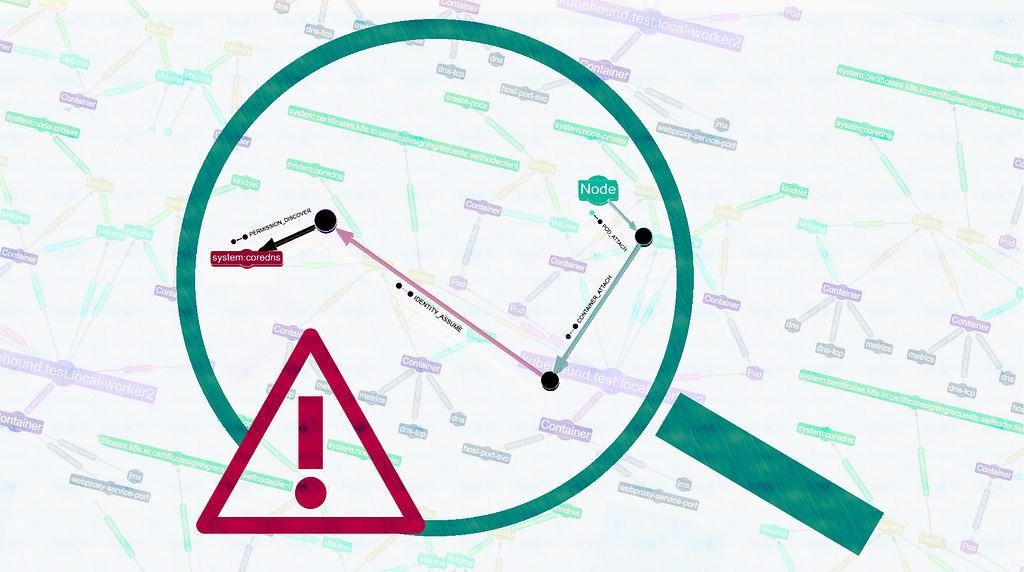
Bolster Your Cybersecurity by Visualizing Attack Graphs With Neo4j & G.V()