Detect Fraud Faster With a Transaction Graph

Graph Database Product Specialist, Neo4j
7 min read
Financial Crime is Getting Harder to Uncover
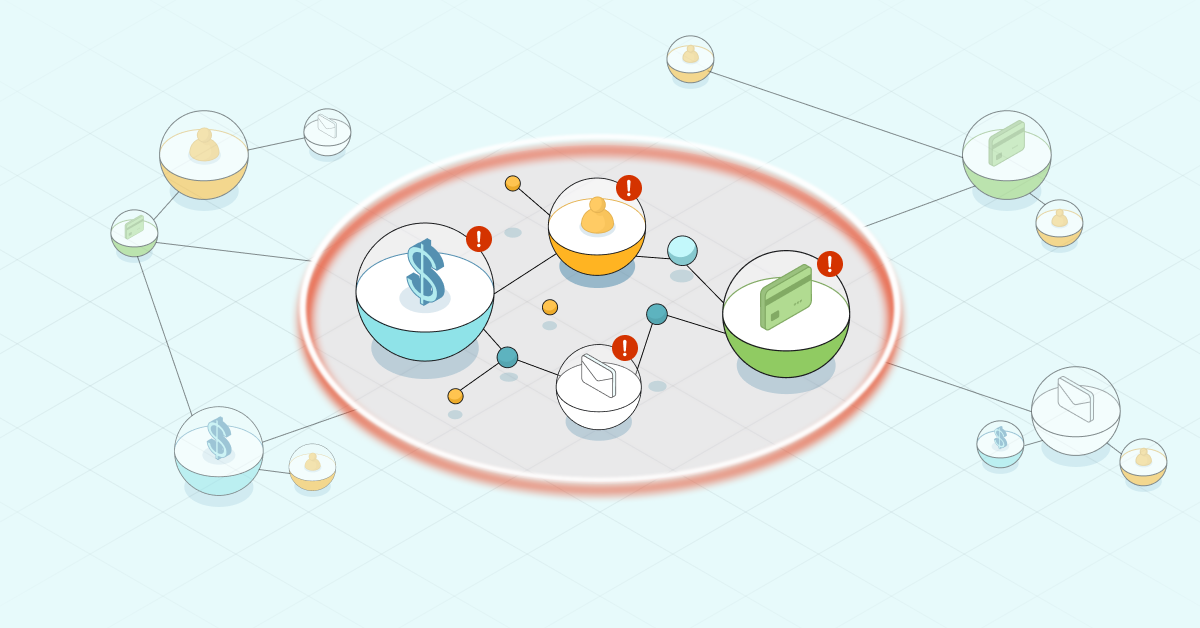
A few small purchases— a familiar ride-hailing service charge, maybe a food delivery here and there. Each of these transactions clears your fraud detection pipeline with no issue. The cardholder’s behavior seems normal until you realize the same device fingerprint appears on 30 different accounts, each using different names, addresses, and cards.
Sophisticated and fast-moving, modern financial crime doesn’t break obvious rules— it slips through the gaps between them. Fraud rings operate across networks of accounts, merchants, and devices, and often use AI tools that make synthetic identities harder to detect. These tactics are evasive and difficult to spot in a timely fashion, especially in digital payments and real-time banking, where decisions must be made in milliseconds. Detection pipelines have to keep up, but most aren’t built for that level of speed or complexity.
Most fraud tools are designed to evaluate transactions in isolation, which makes it hard to detect coordinated fraud across accounts, devices, and merchants. They struggle with complex fraud patterns that are difficult to see using static rules and scattered, siloed data. This leads to false positive rates as high as 95 percent, overwhelming fraud teams and slowing responses. The cost of that inefficiency adds up quickly. In 2025, U.S. businesses reported losing nearly 10 percent of their revenue to fraud, much of it compounded by operational overhead from manual reviews and delayed investigations.
Traditional Tools Create Fraud Blind Spots
At the data layer, most fraud tools depend on relational databases. By design, these databases store each transaction as an individual row, which fragments activity across accounts, devices, and identities. Following a trail of related behavior requires stitching data together through complex, JOIN-heavy queries that are slow to run and difficult to maintain as fraud tactics change. As a result, teams have low visibility and struggle to see coordinated activity across entities.
Machine learning can help, but it can’t fully compensate for this lack of connected context. Models trained on historical patterns struggle to recognize new fraud schemes, especially when the underlying data obscures relationships. Even well-tuned models miss the full story when the data is fragmented.
The same problem shows up in rules-based detection. These tools rely on flags like unusual locations and transaction amounts or mismatched IPs, but they evaluate these signals in isolation. Without understanding how accounts, devices, and transactions connect, alerts fire too broadly. Activity that looks suspicious on its own may be perfectly normal in context, driving false positive rates sky-high and overwhelming fraud teams. False positives and false negatives often come from the same root cause: disconnected data that lacks the structure needed to reveal coordinated behavior. To stay ahead, teams need to see past individual transactions to the network of connections behind them and understand the context those connections reveal.
From Isolated Records to a Connected Model of Risk
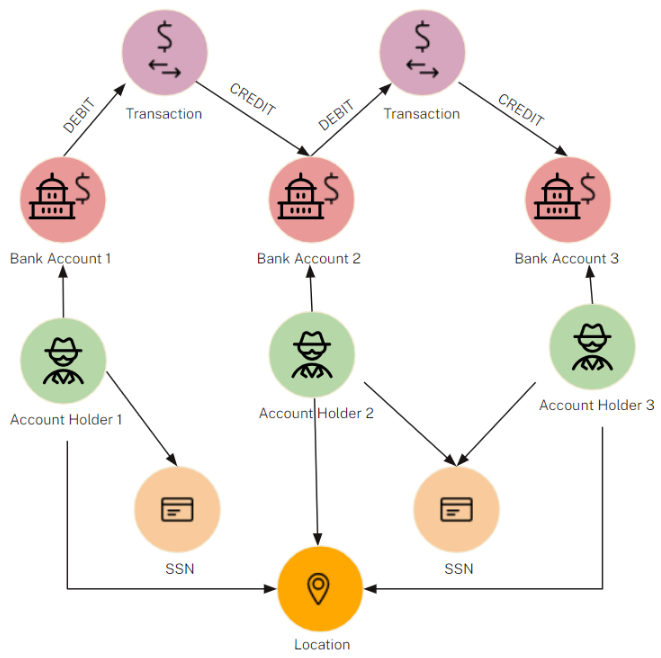
Real-time fraud detection depends on having a clear view of how transactions behave across your business. A graph database stores the relationships between entities. When you model your transaction data as a knowledge graph, it becomes a Transaction Graph: a living, flexible model that connects transactions to the accounts, customers, devices, merchants, and behaviors behind them, giving teams a connected view of how risk moves through the environment.
More than just linking data from different sources, a Transaction Graph surfaces relationships that provide context, helping teams understand why activity looks risky and where to focus attention before losses escalate.
Relationships are built into the graph structure so teams can explore behavior across multiple hops without complex queries or schema changes. And there’s no need to overhaul your current setup because the graph works alongside existing rules engines, models, and case management tools. A graph-based approach complements existing systems by surfacing hidden context in real time, improving detection without disrupting what already works.
When teams can follow risk as it develops and adapt as tactics evolve, they can respond faster and with greater precision. Investigations move more quickly to catch fraud earlier, and legitimate customers are less likely to be delayed or flagged in error. That leads to stronger performance across both fraud and compliance programs without compromising the customer experience.
Fraud Detection Accelerated
Learn how graph databases strengthen your fraud detection solution and help you stay ahead of evolving threats.
Graph-Powered Fraud Detection in Action
For real-time payments provider iuvity, fraud detection had to happen in milliseconds so that customer experience isn’t negatively impacted— even slight delays can frustrate customers and erode trust. But as transaction volumes grew, so did the complexity of fraud attempts and the limits of traditional tools.
To meet that challenge, iuvity used a Transaction Graph to build its risk assessment engine, iuviPROFILER. The system continuously maps how accounts, devices, and transactions are connected, spanning more than 250 million nodes and 2.2 billion relationships. It handles hundreds of transactions per second, with most queries completing in just tenths of a millisecond.
By combining pattern matching, anomaly detection, and machine learning using the structure of the graph, iuvity doubled its fraud detection rate without increasing false positives. The system protects billions of transactions annually while keeping friction low for legitimate users and helps prevent more than $40 million in fraud losses each year. Because the graph model is flexible, the team can add new inputs or evolve detection strategies without taking systems offline or rewriting the core model. The solution also supports seamless cloud deployment, allowing the team to scale as needed without added complexity.
| Key Outcomes From iuvity’s Graph Approach Scale: 250M+ nodes, 2.2B+ relationships Speed: ~500 transactions per second with sub-millisecond query times Impact: 2x increase in fraud detection with no rise in false positives Business outcome: $40M+ in fraud losses prevented annually Flexibility: No downtime required to add new signals or evolve the model |
While iuvity focused on payment fraud, the same approach applies to other financial crime use cases. A Transaction Graph makes it possible to trace multi-hop connections in money laundering investigations, spot shared patterns in staged insurance claims, surface device reuse in account takeovers, or flag risky behaviors in credit applications. Wherever data is connected, a Transaction Graph helps teams follow the trail of risk in real time.
Expand Visibility Across Your Enterprise
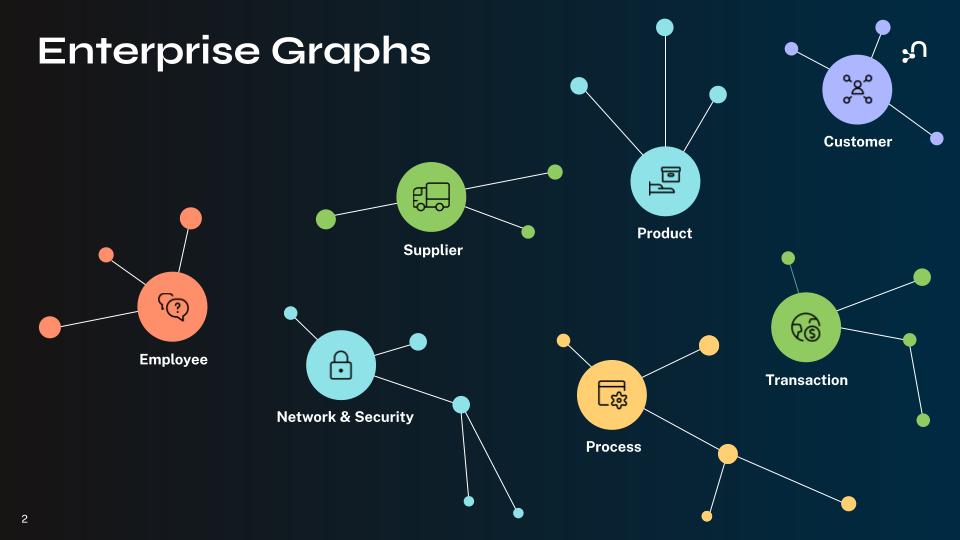
A Transaction Graph gives fraud teams the ability to trace the behaviors and relationships behind suspicious activity, but that’s just one piece of a larger data strategy. You can extend the same graph-based approach across your organization using core enterprise graphs that reflect how people, systems, and resources connect:
- Customer Graph: Maps relationships across interactions, preferences, and journeys
- Transaction Graph: Reveals patterns in financial flows and payment relationships
- Employee Graph: Captures skills, roles, and institutional knowledge
- Product Graph: Connects offerings, components, and dependencies
- Process Graph: Visualizes operational workflows and business logic
- Network and Security Graph: Monitors systems, access patterns, and risk exposure
- Supplier Graph: Links vendors, materials, and resources across your supply chain
Together, these enterprise graphs provide a clearer and more comprehensive view of your business. Teams can see how one decision affects another, even across departments, making it easier to spot risks and prioritize actions. And because the model adapts as your business (and data) grows, it helps you stay ready for whatever comes next.
Act Faster With Connected Fraud Detection
A Transaction Graph gives fraud teams the visibility they need to spot threats as they emerge, providing insight that helps reduce false positives to stop fraud earlier and speed up investigations without interfering with valid activity.
Built to adapt, a Transaction Graph gives you a flexible foundation that evolves as fraud does. As tactics shift, teams can introduce new indicators and adjust strategies to improve their current approach and stay prepared for new fraud scenarios.
Learn more about how a Transaction Graph can help strengthen fraud detection:
- Exploring Fraud Detection With Neo4j & Graph Data Science
- Detecting Bank Fraud With Neo4j: The Power of Graph Databases
- Elevate Fraud Detection With Neo4j on AWS: Uncover Hidden Patterns and Enhance Accuracy
- Mastering Fraud Detection With Temporal Graph Modeling
Fraud Detection Accelerated
Learn how graph databases strengthen your fraud detection solution and help you stay ahead of evolving threats.
Share Article


Explore
Related Articles

Why Machines Need Embeddings: Turning Graph Structure into Features

A Complete Guide to Production-Grade PrivateLink Setup for Neo4j Enterprise Edition
Capgemini Turns Data and AI Into Connected Intelligence With Neo4j and Databricks

Neo4j Community Edition Advances for Graph-Powered AI and Intelligent Applications
Power Connected Intelligence for AI and Analytics with Neo4j and Databricks