Find More Fraud with Graph Data Science [Infographic]

Graph Analytics & AI Program Director
1 min read

Financial fraud is growing more sophisticated every day – and fraudsters are not slowing down their efforts. To detect and prevent costly fraud schemes, you need a better understanding of your data.
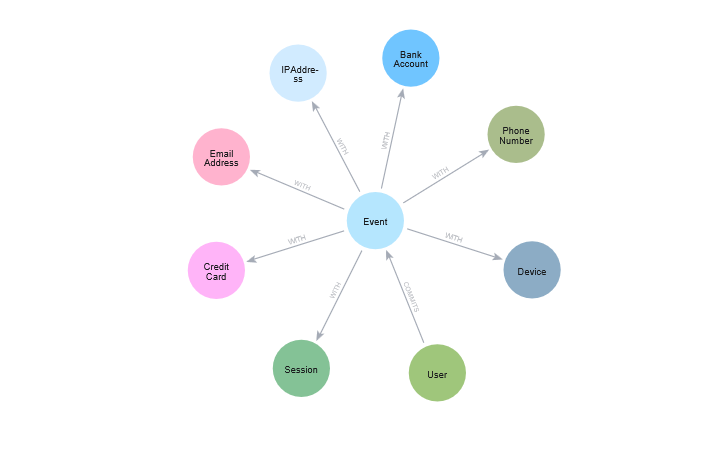
This infographic breaks down how graph data science unleashes the power of your existing data, tapping into hidden patterns and connections to uncover fraud.
Check out the infographic below to learn more about using graph data science to power your fraud detection efforts.
Click infographic for high resolution image.
Share this infographic on Twitter!


