
From Graph to Knowledge Graph: Data Trends and Challenges

Sr. Program Director, Knowledge Graphs
3 min read
Unleashing the power of knowledge is imperative for enterprises looking for a competitive edge.
Everyone wants to capture knowledge, to connect everything that they know. However, turning data into knowledge is still very much an ongoing effort – though progress has been made, most data landscapes are far from mature.
We need a way to connect the data we have, across all systems, clouds, backups, and data lakes. Some of our data pipelines may be strong – serving real-time, clean data to dashboards and informing business processes – but that’s not enough. That success must be replicated everywhere.
It’s time to connect data so it’s manageable and useful. Anyone in your organization who needs data to do their job should know where to look for it, be confident in its accuracy, and be able to solve their own problems with ease.
In this blog series, we’ll guide you from graph to knowledge graph – by starting small, gaining immediate value, and then expanding outward – the start of a short journey to unlimited insights.
In this first blog of our three-part series, we’ll discuss today’s data trends and challenges.
Part 2: How a Graph Becomes a Knowledge Graph
Part 3: Actioning vs. Decisioning Knowledge Graphs
Silos
First, there’s siloed data. Data stores and applications often serve individual groups or departments. The HR team has one platform, and the sales team may use another such as Salesforce. Systems of record are important because they maintain and control data and establish governance policies, but data silos also reduce speed to analytics, accuracy of reporting, and data quality.
Data Sprawl and Data Lakes
Most organizations have data lakes, data warehouses, relational databases that underlie systems of record, customer data, transactional data, product data, and order data, and the list goes on. This scattering of data contributes to data sprawl.
Data lakes are popular as a low-cost option for storing large amounts of structured, semi-structured, and unstructured data. Object storage such as Amazon S3 is often used to create data lakes.
From a cost standpoint, data lakes are attractive; they give you a place to store any type of data, including log files generated by applications and services. It’s easy and convenient to put data into a data lake. However, governing that data and even knowing what is there becomes a challenge.
Cloud Storage
Cloud computing is revolutionary and yet remains a governance challenge, with more data stored in more systems. Consider your own personal cloud data, which may live in iCloud, Google Drive, Dropbox, and more, as well as in Evernote, Gmail, and Notes.
This leaves us with a massive amount of data that is not only in different data formats and partially redundant but also largely disconnected.
Murky, messy data is a compliance nightmare.
If GDPR compliance says you need to forget a person’s data, do you know where all their data is? What about cookies that you may not even realize belong to that person? What about data in your logistics system and in your partner’s systems?
Historical Data Goes Right Out the Window
Historical data fuels machine learning predictions. But the COVID-19 pandemic made historical data obsolete as disruption rippled across the economy. For example, historical data would normally be used to predict purchasing behavior.
The pandemic caused purchasing behavior to change almost overnight as online shopping came to dominate the market during the lockdowns. Due to these dramatic shifts in consumer behavior, historical data could no longer make accurate predictions about purchasing behavior.
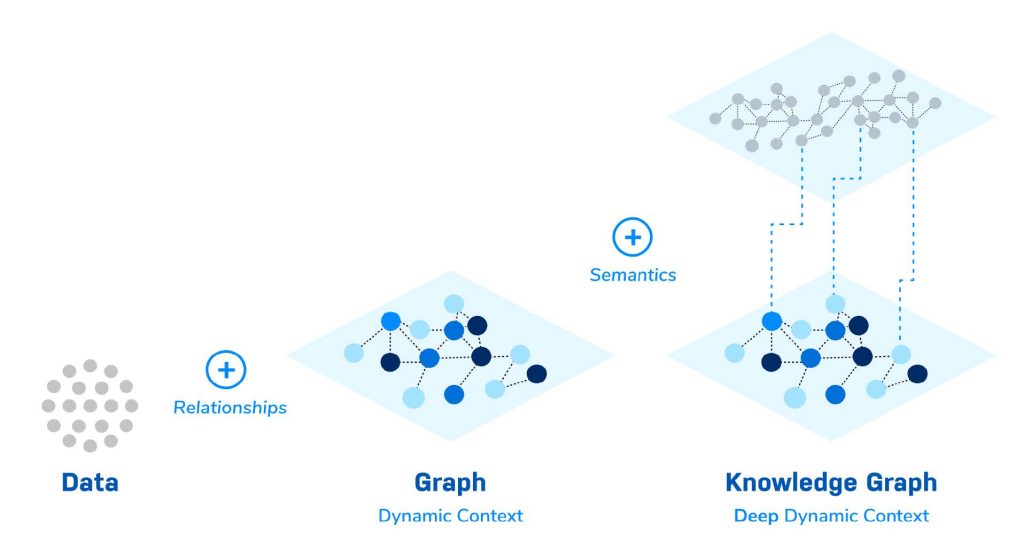
With limited data, connections in the data increase in importance and value. Putting data in a graph database captures connections and relationships.
The data you have is valuable, but storing the relationships in and across that data – relationships that already exist – increases your ability to predict even in the absence of relevant historical data. That’s because connections and relationships are the most predictive elements in the data.
Conclusion
All of these factors are driving enterprises like yours to move toward connecting data in a graph database to gain knowledge.
Next week, in blog 2 of this series, we’ll examine exactly how a graph becomes a knowledge graph.
Share Article


Explore
Related Articles


How to Improve Multi-Hop Reasoning With Knowledge Graphs and LLMs


