From graph to knowledge graph: How a graph becomes a knowledge graph

Sr. Program Director, Knowledge Graphs
7 min read
Unleashing the power of knowledge is imperative for enterprises looking for a competitive edge.
Everyone wants to capture knowledge, to connect everything that they know. However, turning data into knowledge is still very much an ongoing effort – though progress has been made, most data landscapes are far from mature. It’s time to connect data so it’s manageable and useful.
In this blog series, we’ll guide you from graph to knowledge graph – by starting small, gaining immediate value, and then expanding outward – the start of a short journey to unlimited insights.
Part 1: Data Trends and Challenges
Part 3: Actioning vs. Decisioning Knowledge Graphs
In the second blog of our three-part series, we’ll discuss how a graph becomes a knowledge graph.
What is a knowledge graph?
Here is a definition:
A knowledge graph is an interconnected dataset enriched with semantics so we can reason about the underlying data and use it confidently for complex decision-making.
Now let’s unpack that definition a little at a time.
The value of connected data
Connecting data adds context and improves outcomes. The best doctors do their homework. If a doctor takes the time to review the reason for the appointment – your medical conditions, your medical history, any lab tests you’ve had, and your vital signs – that visit will be far more productive. The doctor has context: the context of you.
A more obvious example is LinkedIn, where the number of connections we have is considered a measure of success (500+ connections). Like all prominent social networks, LinkedIn is built on a graph data structure.
A satellite manufacturer wanted to integrate all of its processes and data across the entire life cycle of its highly complex products – Product 360.
“In the past we’ve had someone manually identify the root cause of a failure,” said the chief data officer. “They’d look at everything that could have influenced a part’s failure. Is it engineering? Procurement? Supplier? Is it a vendor issue or a manufacturing defect? The idea is to let the graph do those traversals and find variance and report it back instantaneously versus a human taking weeks to do it manually.”
Enriched with semantics
Connecting data makes that data inherently more valuable and provides dynamic context. Adding even more information – semantics – takes that value to a new level.
In practical terms, if you create a graph, even a graph on a whiteboard, you will find yourself wanting to add more detailed information. That additional information is semantics: an overlay of meaning on top of the graph.
At NASA, David Meza sought to incorporate hundreds of millions of documents, reports, project data summaries, lessons learned, scientific research, medical analysis, and more into a knowledge graph. Meza ran the text of all these documents through a topic modeling algorithm that uncovered tags that could be applied to the content, enriching the graph.
According to Meza, NASA’s Lessons Learned knowledge graph accelerated the mission to Mars, saving at least a year and over $2M in research and development.
So given his experience, what is Meza doing now? He’s moved onto the next frontier: finding the right people to move NASA forward at a time when the private sector is diving in deep.
Talent is naturally a graph. NASA’s new knowledge graph is used to find people with particular knowledge, skills, and abilities. But roles and job titles are not standardized, so Meza mapped them to existing ontologies from government databases, including the US Department of Labor’s O*NET, OPM (Office of Personnel Management) classifications, and the EU’s ESCO.
While NASA has particular needs when it comes to hiring talent, this is a broad challenge most organizations face – one where a knowledge graph could be of benefit no matter the mission.
Reason about the underlying data
Knowledge graphs provide deep, dynamic context. They enable people to find all related information in one place, with all of the relationships across that data. As you add more information, knowledge graphs become increasingly valuable.
For example, with NASA’s Lessons Learned Knowledge Graph, the engineers could look at any particular part and gain insight into how it is used. Engineers could ask for a particular part and find out which subsystem it relates to. They might explore how all of the subsystems managed by different groups come together and try to get a feel for the system as a whole.
Fraud investigators find themselves drowning in thousands of alerts of potential fraudulent activity. Sifting through these alerts requires looking in several systems, which is time-consuming. A knowledge graph brings together many data sources, in this case customer attributes, credit scores, location, payment history, and more, so that investigators quickly hone in on fraudulent activities and see patterns they would not have noticed otherwise.
Use it confidently
Data brawls. You may not have seen a bar room brawl, but most of us have seen a data brawl (or, more politely, a data disagreement). They arise from discrepancies where the numbers just don’t match. “Where did you get your numbers?” someone asks. “That’s not what my data says.”
How can we use data confidently? By knowing where it came from, how much transformation it’s been through, whether it’s been cleansed, when it was last updated, and who updated it.
With a knowledge graph, it is easy to add this type of metadata to the graph. Knowledge graphs excel at capturing details about data, and this metadata becomes part of the knowledge graph. In the event of a data brawl (or data discussion), these types of details are invaluable in investigating any discrepancies.
For complex decision-making
“When you start looking at what kind of documents you have and how you’re able to transform those into actionable knowledge for your end users, you improve your decision-making,” said David Meza, senior data scientist at NASA.
Dooloo, a startup based in France, has developed a knowledge graph-based platform to assist people who experience chronic pain. By combining a person’s unique history with the latest research and treatments, patients and their caregivers quickly discover next steps to improve their quality of life and better manage their symptoms.
A short journey to unlimited insights
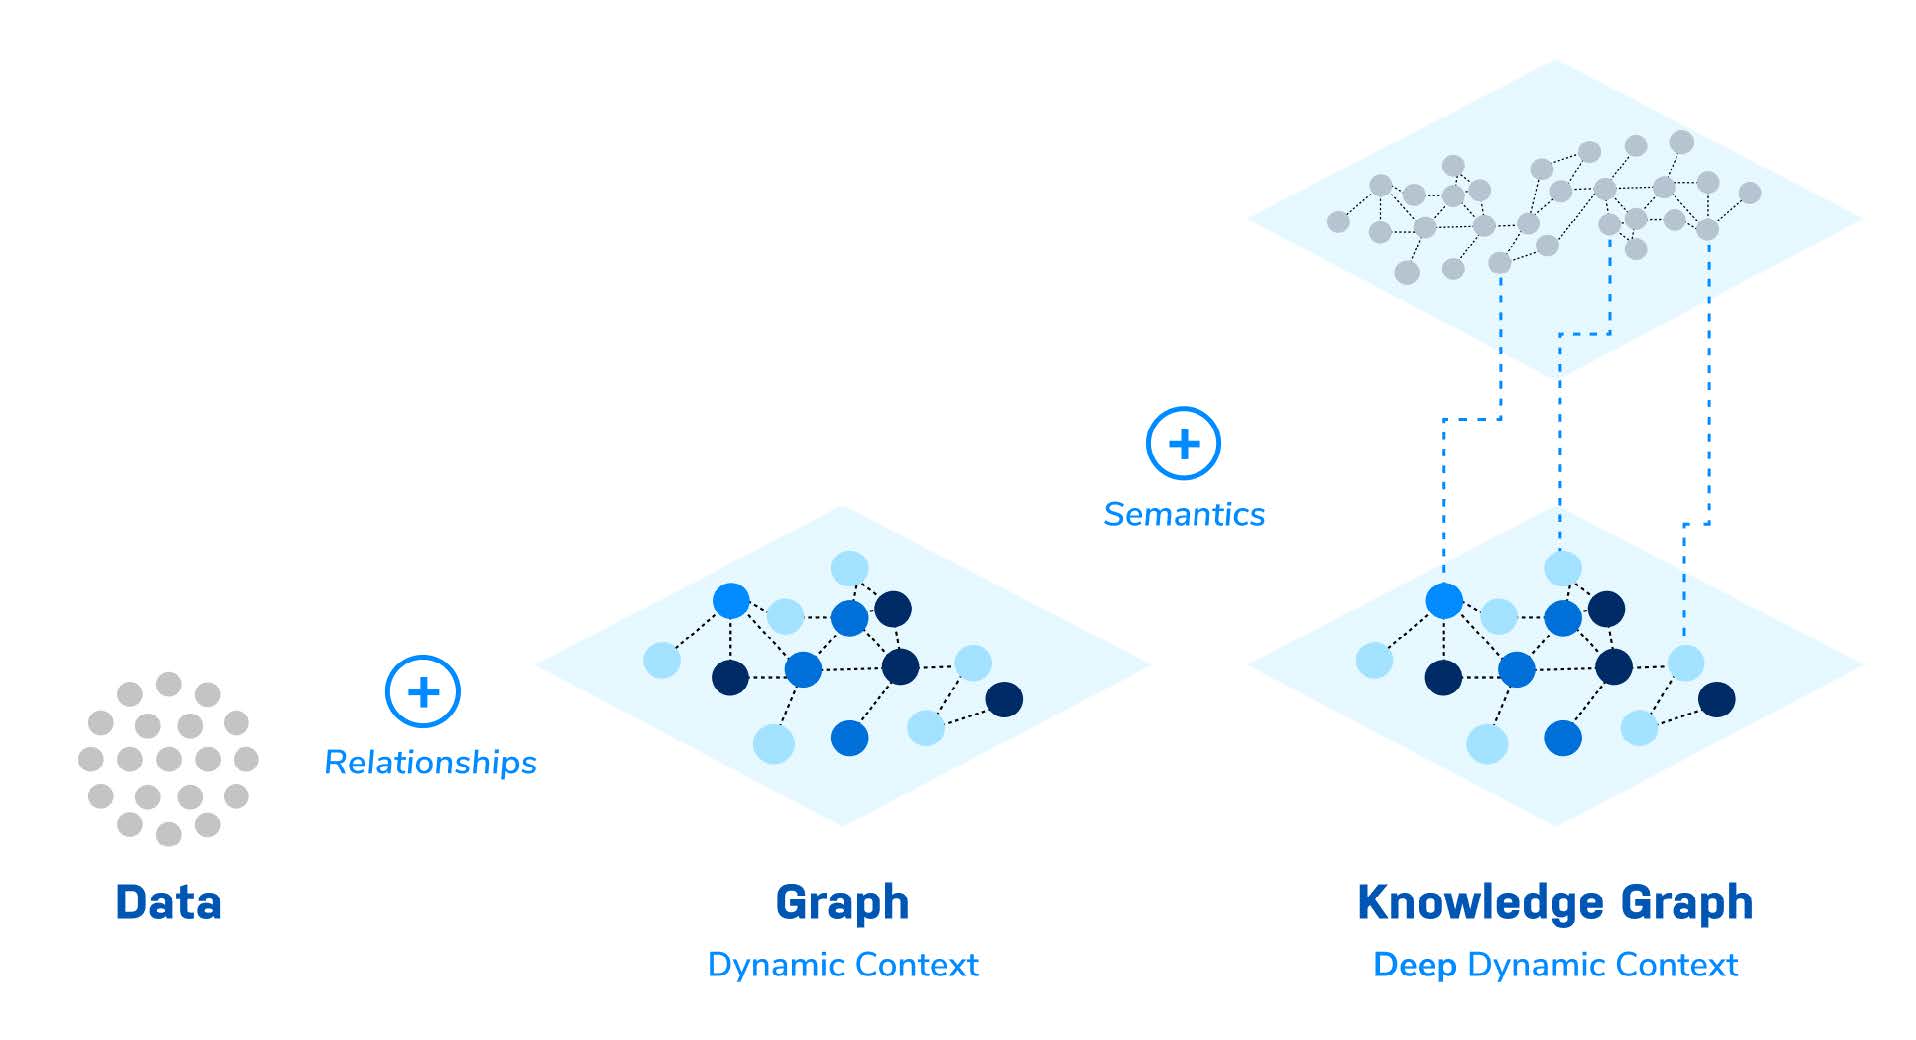
A graph becomes a knowledge graph when we overlay an organizing principle. In this way, knowledge graphs make data smarter.
The transition from graph to knowledge graph is subtle and organic. Create a graph of your supply chain, for example. Add in information about how long you have worked with partners in that supply chain, their locations, modes of transportation, discounts, and any delays in shipping that must be factored in – and you’ve got yourself a knowledge graph.
Conclusion
This is the beauty of knowledge graphs in Neo4j. You can start small, solving a practical challenge of any kind, and enrich your knowledge graph incrementally to solve additional use cases and serve additional stakeholders.
If you decide to tweak the structure of your knowledge graph or add data sources, Neo4j makes it simple to modify the structure of your graph and reflow the data into that structure. That agility is part of the underlying graph database.
This deceptively simple structure supports advanced AI and machine learning. It is no wonder that every graph data science project starts with a knowledge graph.
Next week, in the final blog of this series, we’ll go over the two categories of knowledge graphs.
Share Article


Explore
Related Articles

Neo4j Named “One to Watch” in Snowflake’s 2026 Modern Marketing Data Stack Report

POLE+O: The 5-Type Ontology That Solves the Hardest Part of Building a Knowledge Graph

1 of 3: The difference between a graph, a knowledge graph, and a context graph
