The future of graph visualization: An interview with Tom Sawyer Software


5 min read
 Editor’s Note: Tom Sawyer Software is a Gold sponsor of GraphConnect San Francisco. Register for GraphConnect to meet the Tom Sawyer team and other sponsors in person.
Graph visualization is a hot topic within the software community – especially for Neo4j users – but finding the right tool is about more than just an eye-catching display.
In this interview between Silvia Chiang and Emel Dogrusoz of Tom Sawyer Software, we discover the difference between a good graph visualization software and a great one.
Here’s what they covered:
Tell me about yourself and what you do at Tom Sawyer
My name is Emel Dogrusoz and I am the Principal Technical Product Manager at Tom Sawyer Software, and have been with the company since 2007. I currently use my experience and knowledge to guide Tom Sawyer Software’s Products and Professional Services teams.
Working primarily with the Products group, I help to define upcoming software requirements and software release feature sets, and also work on the company’s consulting projects, coordinating customer needs while managing the engineers working on each of these projects.
What’s the brief history of Tom Sawyer? When were you founded?
Tom Sawyer Software was founded in 1992 and was the first commercial software company to focus solely on graph visualization, layout and analysis component software solutions. Our founders recognized that businesses were accumulating a vast amount of data that was quickly becoming unmanageable, so they started Tom Sawyer Software with the mission to provide graph visualization applications to help businesses decipher and sift through their data.
Our many years of working with small and large software companies has made us the trusted leader. Today, we are expanding upon that original mission to provide businesses with a comprehensive and configurable enterprise software stack with our flagship product, Tom Sawyer Perspectives.
A fun fact about us is that the name of our company came from the “Tom Sawyer” song by the Canadian rock band Rush.
Talk to me about Tom Sawyer’s main offerings — what do you guys do?
Tom Sawyer Software helps its customers create highly scalable and flexible applications that allow them to make sense of their rapidly accumulating data. Our flagship product, Tom Sawyer Perspectives, is a graphical Software Development Kit (SDK) that combines the company’s graph visualization, layout and analysis technology to deliver terrific data visualization applications.
As we have matured in the last few years, we are now becoming a formidable data visualization contender. But as we do it, we’re doing it from a position of strength from our trusted and and well-known expertise in graph technologies.
What sets Tom Sawyer apart from your competition?
As pioneers in the graph visualization, layout and analysis space, we have unmatched expertise in the field and leverage this experience to provide new innovations to our products and product features.
Tom Sawyer Perspectives can lay out graphs that scale up to tens of thousands of nodes with ease, and includes a wide variety of graph analysis techniques, such as clustering, dependency, impact and root-cause analysis, path-finding, traversals and social network analysis.
But we believe that one of the biggest advantages of Tom Sawyer Perspectives is our graphical development environment, the Designer, which facilitates an advanced Design → Preview → Deploy application development process. The Designer supports concepts of schema, federated data integration and synchronized rule-driven views of data.
Data integrators include Neo4j, REST, JSON, XML, Text, SQL, Excel, RDF and InfiniteGraph. Data views include drawings, maps, charts, timelines, tables, trees, and inspectors to facilitate visual analysis from different perspectives.
You can build .NET and Java web and desktop applications that use the most modern HTML5 rendering technology.
These capabilities make Tom Sawyer Perspectives simple to use, allowing users to quickly create data visualization applications with minimal development effort.
What is the biggest challenge your customers are facing right now, and how would you suggest they overcome it?
Our customers are quickly amassing data from a variety of different outlets. They understand that there is critical information within this data, but do not have an easy way to uncover that information and may not even know where to start looking.
To assist with organizing their data and understanding the relationships within their data, we recommend them to use graph databases such as Neo4j. Once they understand the pieces of information that are critical, we believe graph visualization and analysis applications assist organizations in identifying patterns and trends in data that are not easily visible otherwise.
In turn, this enables organizations to make timely and critical decisions based on accurate information.
How is Tom Sawyer connected to Neo4j?
Tom Sawyer Software and Neo Technology are close partners, as graph databases and graph visualization is a perfect pairing that goes hand in hand. Tom Sawyer Perspectives includes full integration to connect to Neo4j databases, allowing users easy access to their data.
Users can also dynamically update information within the views themselves and – with minimal coding – write these updates back to Neo4j. We write our queries with the Cypher query language.
As partners, we also work closely with Neo Technology in co-hosting webinars, Meetups, and regularly attend GraphConnect conferences in San Francisco and London. Stay tuned for our upcoming events in the future.
What’s next for Tom Sawyer? What are the exciting features and functionality on your roadmap?
We are constantly working to improve and perfect our software, and provide innovative features for it. One of the exciting features that we will include in the near future is a new graph data model in addition to our table data model.
This new graph model will help us more naturally connect to entities and relationships within graph databases, such as Neo4j, thus allowing easy translation to and from graph databases and increased speed in retrieving data and writing it back to the data source.
We will also be adding more enterprise features, such as user and role management, and we are working on larger and exciting projects on performance and scalability improvements for future releases of Tom Sawyer Perspectives.
Register below to meet and network with the Tom Sawyer Software team – and many other graph database leaders – at GraphConnect San Francisco on October 21st.
Share Article


Explore
Related Articles
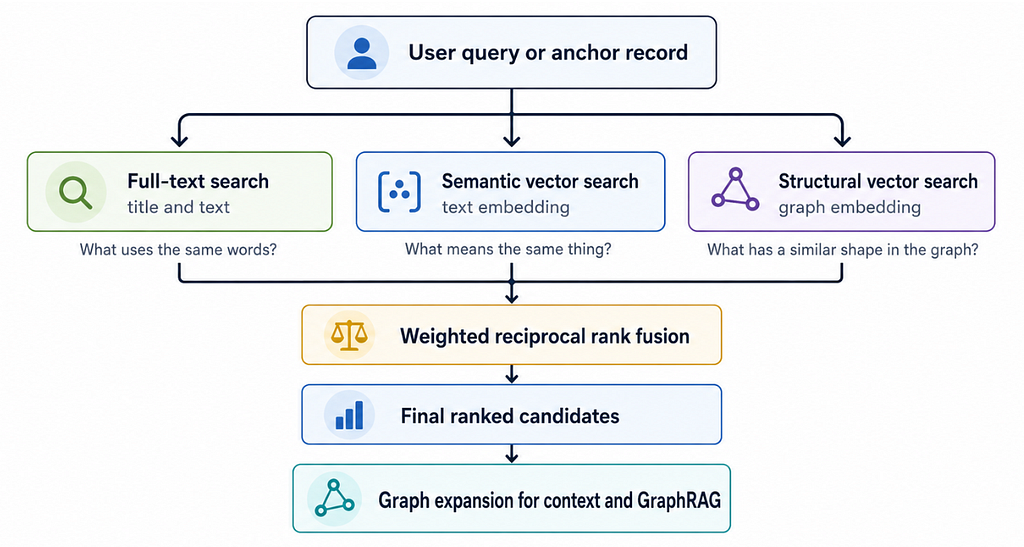
Hybrid Search in Neo4j: Full-Text, Vectors, and Graph Topology with Cypher

A workbench for teams to query, explore, and visualize graph data


Hey LLM, you’re using OPTIONAL MATCH wrong. Here’s the Cypher that actually works.
