The Future of Data Visualization

Chief Executive Officer, Tom Sawyer Software
6 min read
Editor’s Note: This presentation was given by Brendan Madden at GraphConnect New York in October 2017.
Presentation Summary
Tom Sawyer Software is a graph data visualization tool that was founded long before graph databases first hit the market. But with the comparatively recent arrival of both big data and graph databases on the scene, Tom Sawyer has greatly expanded its services as well. Now solutions range from network topology to link analysis, and customers span fields from aerospace to retail.
By relying on Neo4j as the central tool for their data integration, they’re able to offer a variety of data views, along with more detailed graph analysis. The presentation concludes with a variety of demos that cover examples related to data synchronization, governance and filtering.
Full Presentation: The Future of Data Visualization
What we’re going to be talking about today are the challenges of working with big data, and how we’re solving these problems with Neo4j:
My name is Brendan Madden and I’m the CEO of Tom Sawyer Software. We are the leading provider of software for building graph visualization, data visualization, and analysis applications with our flagship product is Tom Sawyer Perspectives.
In the last four or five years, we’ve grown into a full-service data visualization vendor, but we’ve been working for the last 25 years to solve problems related to graph visualization, graph layout, graph analysis and graphics. We’re headquartered in Berkley, California but have offices around the globe in Australia, Germany, Greece, Riga, Latvia and Mexico City.
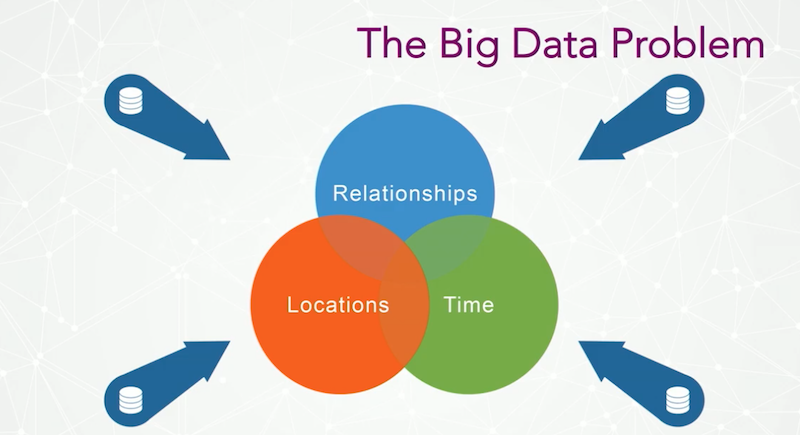
Our initial focus was solely in graph visualization and automatic layout technology problems. But as we’ve begun working with various public sector and enterprise clients, we’ve started to do more work with time-based, location-based and relationship-based data, as well as the federated and siloed data that comes with larger organizations:
Neo4j is the clear leader in the graph database space, and graph is also the most important data trend.
When dealing with so many data silos, the question is: How can we bring all of this data together?
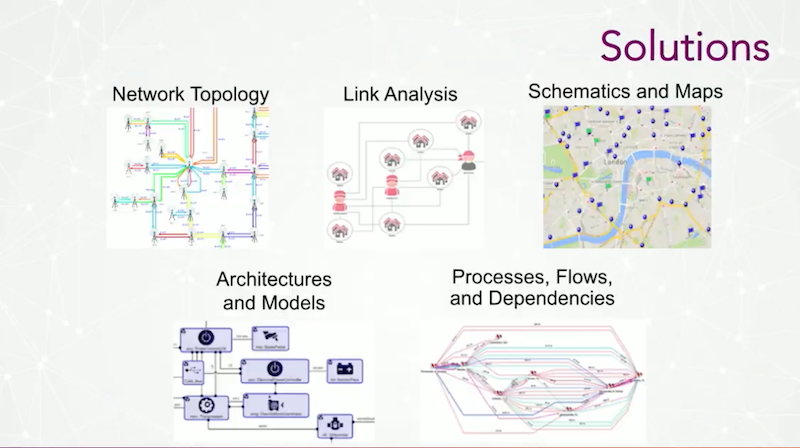
There are a variety of solutions we offer to solve the big data problem for our customers, including the following:
- Network topology helps map equipment in the telecom space
- link analysis is particularly useful for public-sector issues such as fraud-detection, policing and intelligence
- schematics and maps for data related to utilities, electrical circuits and outages
- architectures and models to address problems with enterprise architecture, data models, system modeling and risk models
- Processes, flows and dependencies to address issues related to transaction data, data flow AND processed data.
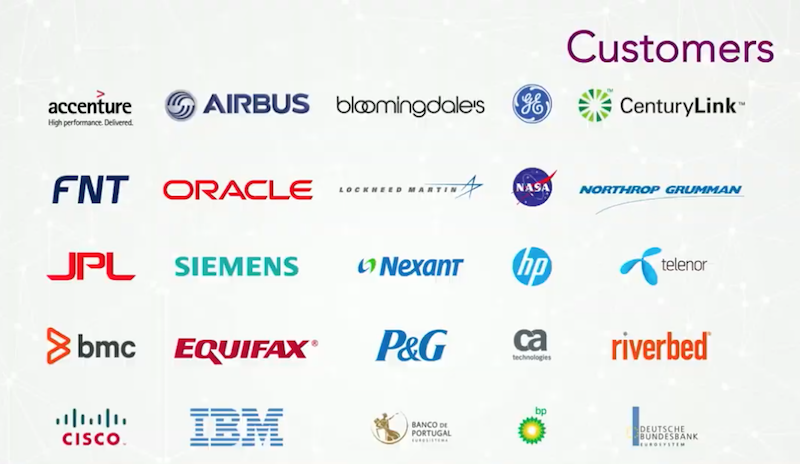
We apply these solutions for a variety of clients throughout the networking, aerospace, retail and financial sectors:
When we first started Tom Sawyer, we built graph visualization tools for software companies. A classic example is the SDK programming kits we built for OEM. But we wanted to move beyond selling to software vendors, and started working with systems-integration firms to do larger projects directly with companies. This moved us away from core programming tool kits towards a more design-oriented model.
Now we have a design-preview-deploy tooling architecture that allows us to decide where to deploy an application after we’ve developed it:

For a single application, you can decide whether you want to deploy in Java, .NET, web or desktop, which we’re able to do with HTML5 technology for web or image-map technology for rendering.
We achieve this by using something similar to an IDE:
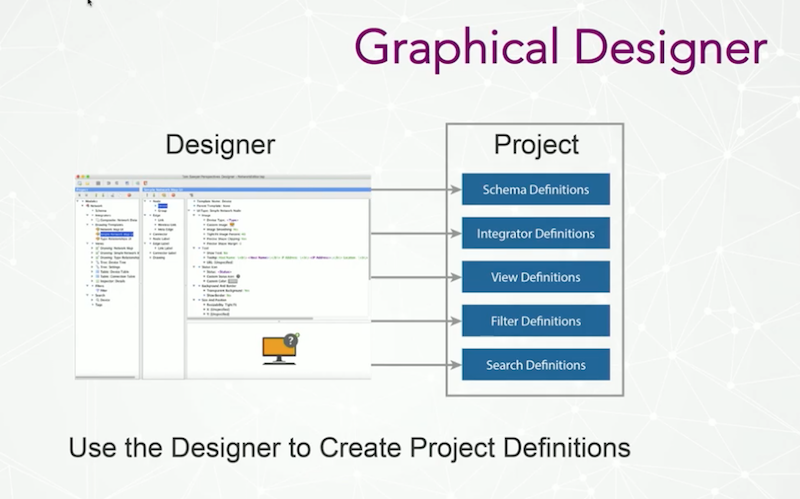
For schema definitions, we work within a specific industry’s entity types.
For example, with a networking client, this could include things like device, switch, router, and bridge service. We also work from the data model of the application, not just from nodes in edges, lengths, shapes or routes. Our design tool allows us to define or load a schema, and tell it what our data is about.
The concept of integrator refers to how we bind to data. We have a federated, update-commit architecture, so we can define bindings to numerous data sources and also write back to those data sources in a federated way.
To provide us with the ability to have multiple, simultaneous, synchronized views of information, we create our own data model. View definitions allow us to write rules to express what we want to see in our graphics for each different view type.
And then we have filter definitions, which is done in the design tool, as well as search definitions. This allows us to do things like search for all the routers in a network, or search for all routers named “San Francisco,” which you can do by both the type and instance level.
The idea is, you define an application and, when you save it, it’s an XML definition of how you go from your data to your graphics and the interactions.
This functionality is possible without writing any code, but the whole product is still a customizable STK. And the views we give people can be embedded in our customers’ applications.
For data integration, Neo4j is our most important source of new activity:
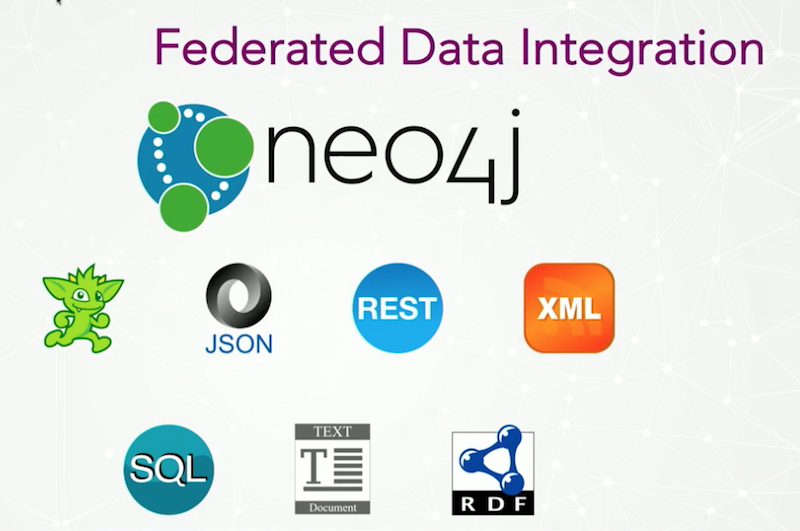
We were the first graph technology company in the U.S., back in the early 1990s, but we didn’t have graph databases yet. We were working with SQL, .txt files and XML files. In more recent times, we also started working with data from JSON, REST, web services, Excel TinkerPop and graph database sources.
The other source is really customer data models, which can write Java code or populate our data model from their data model. We bind this data to multiple sources, including Neo4j, and then integrate it into a single attributed data model that we use to write applications against.
With Cypher and Neo4j Bolt, we’re able to do automatic property graph extraction and use a Cypher-driven population of our application data model. It also allows for rapid application development, and provides fast, easy access for large data sets.
This transfer happens about 15% faster than before the BOLT protocol was available. It also allows us to provide data encryption for improved security.
The next question is: What kind of data views do people have and what kind do they want?
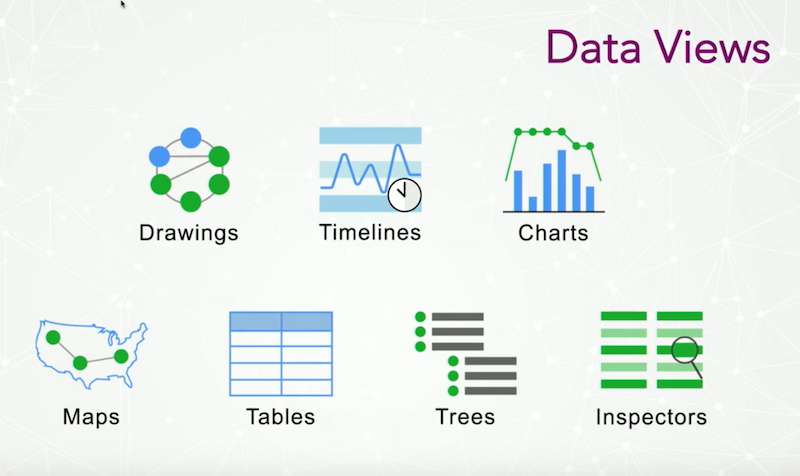
For many years, we were only providing graph-based views of data, which included flow data, web-based data, model-based data and nested drawings. Now we’ve incorporated timeline integration to more effectively work with time-based data.
We integrated charting architecture, and built a new tool called Tom Sawyer Maps, a Google Maps integration with open layers and openstreetmap integration. We also offer table-based views (similar to a spreadsheet view), tree views of data and VB-style inspector views.
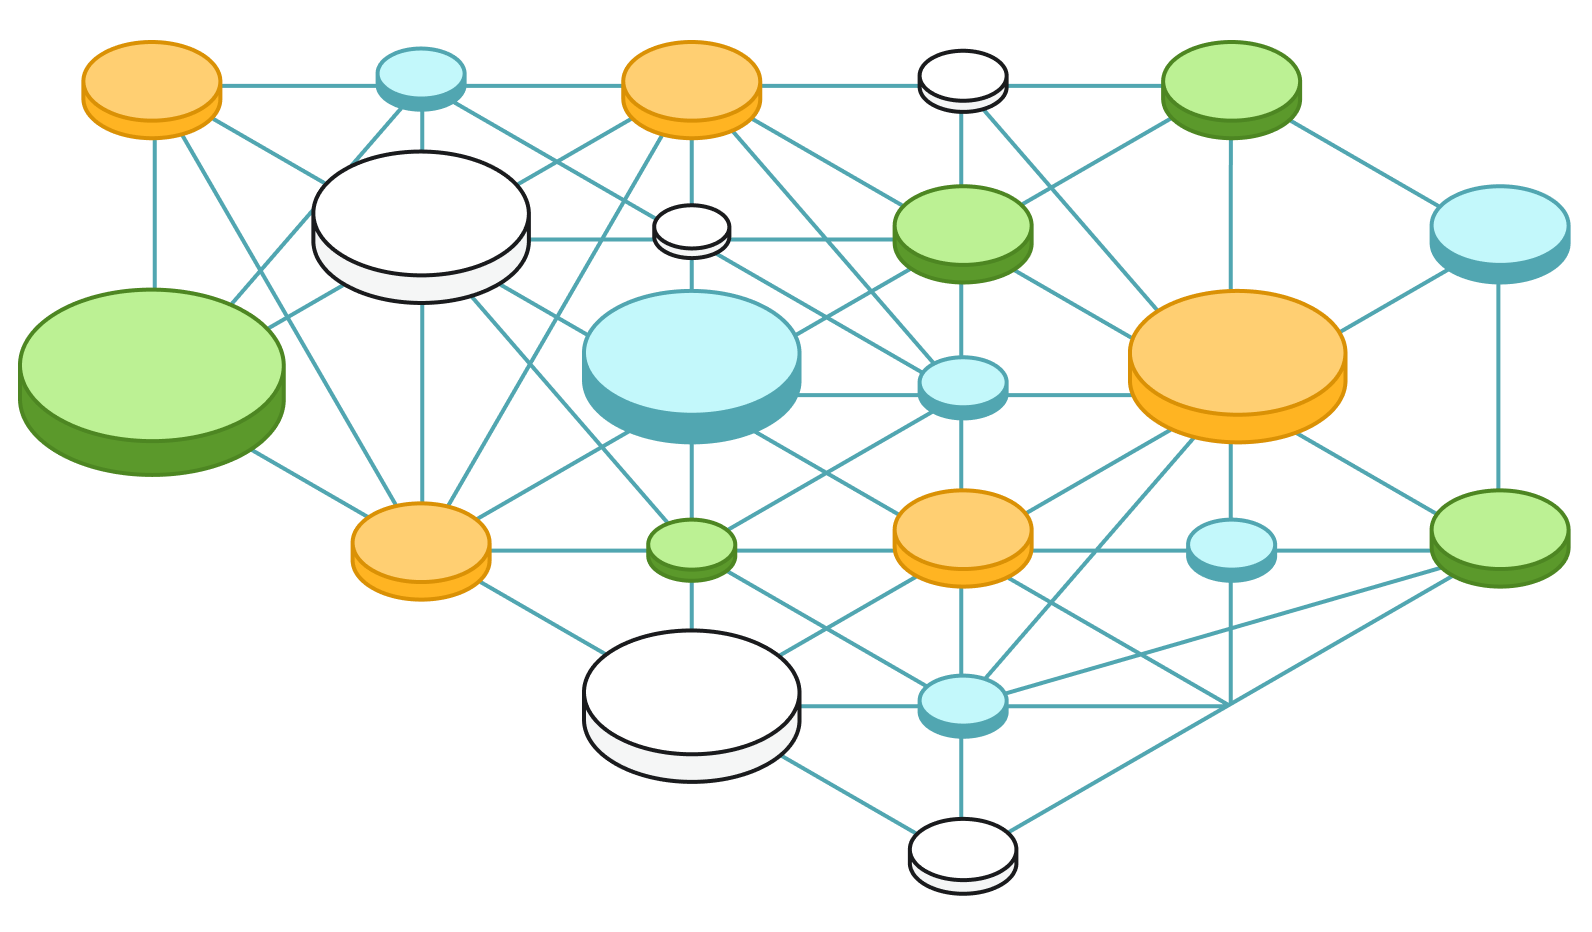
Below is an overview of some of our advanced drawing and layout functions:
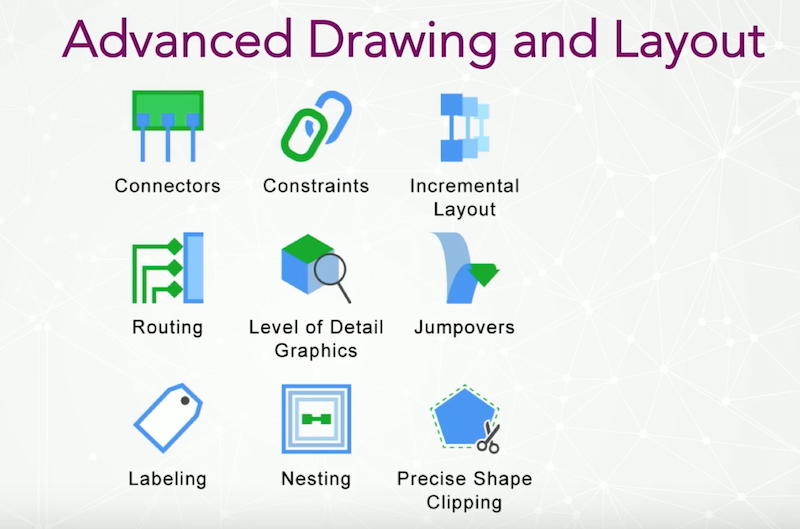
We don’t offer just one spring embedder network view, but instead work with things like electrical schematics and automotive diagrams. We have constraint-based automatic drawing, swim lane processes, incremental layout software (which is like mental math preservation as you make changes to the drawing) and labeling technology.
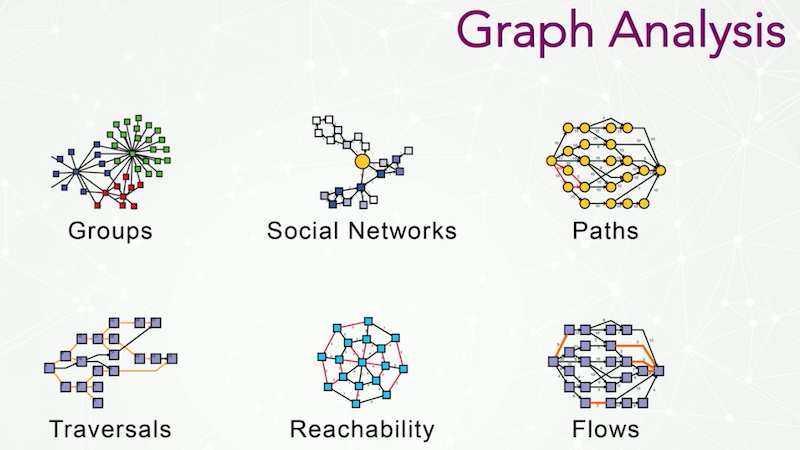
In 2002, we developed our first product in analysis, called Tom Sawyer Analysis:
Tom Sawyer Analysis has around 30 algorithms that can be separated into six broad classes:
- Groups, which refers to partitioning and clustering algorithms;
- Social network analysis, which is for finding the “middleman” or source of information, and relies on different types of centrality;
- Path findings, which is finding the shortest path;
- Traversals, which is like scheduling: A has to fire before B, B has to fire before C, in a dependency graph;
- Reachability, which is essentially neighborhoods. What’s near me in a network?; and
- Network flow algorithms
Demos
This first demo walks you through a simple example of data synchronization:
This next demo covers the same topic but with web deployment:
This next demo covers a more complicated governance example:
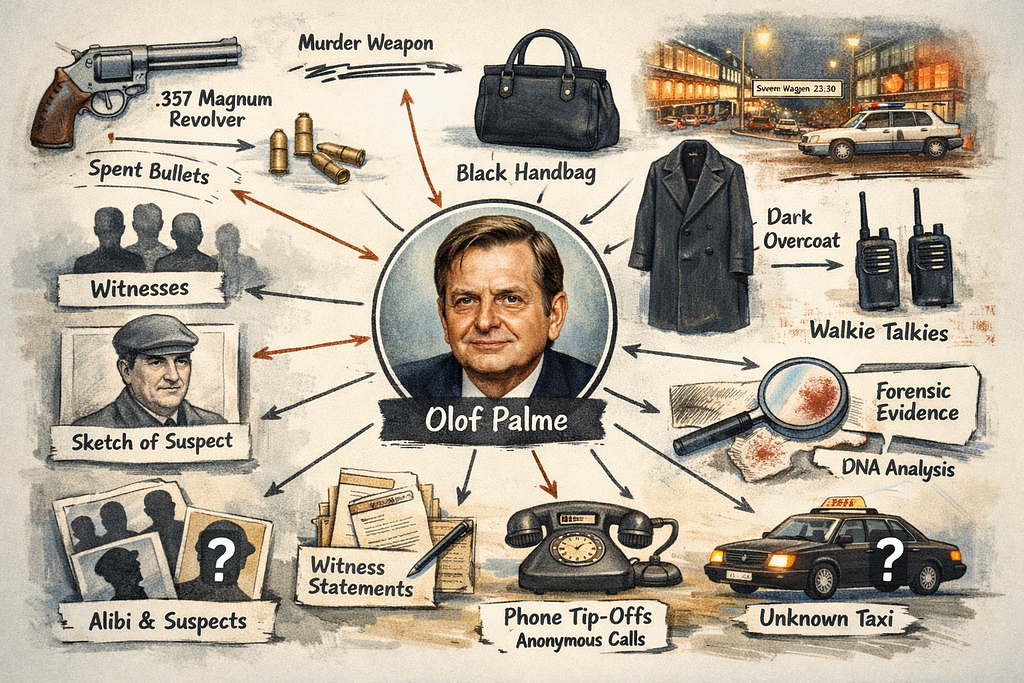
The following demo ties together graphics, synchronization, filtering and multiple views through the use of actual incident-related police data from Seattle:
Now we’re going to walk through some solutions via the Tom Sawyer website tool. This is a Neo4j application looking at government data on the topic of commodity flows across a variety of states:
Share Article


Explore
Related Articles

Hey LLM, you’re using OPTIONAL MATCH wrong. Here’s the Cypher that actually works.