And the #ShowMeYourGraph Graph Visualization Winners Are…

Community Manager
2 min read

Thanks to everyone who submitted for our #ShowMeYourGraph Graph Visualization Twitter Contest! We loved reviewing all of the awesome graph visualizations. Click here to see all of the contest entries.
And congratulations to our #ShowMeYourGraph winners Aru Sahni, Peterson Junior and John Swain! Each #ShowMeYourGraph Graph Visualization Twitter Contest winners receives: a free pass to GraphConnect 2014 SF, an iPad Air and Pencil made by our friends at FiftyThree.
Most Creative Graph Visualization:
The composition, relations, and introduction times of resolved entities in our db. #ShowMeYourGraph @GraphConnect pic.twitter.com/8RZxj0IYHs
— Aru (@IAmAru) August 29, 2014
Most Innovative Graph Visualization:
Visualizing the data flow of a Data Warehouse (SAP BW) with awesome neo4j and gephi. #ShowMeYourGraph @GraphConnect pic.twitter.com/Wc3Il1R40v
— Peterson Junior (@petjr) October 2, 2014
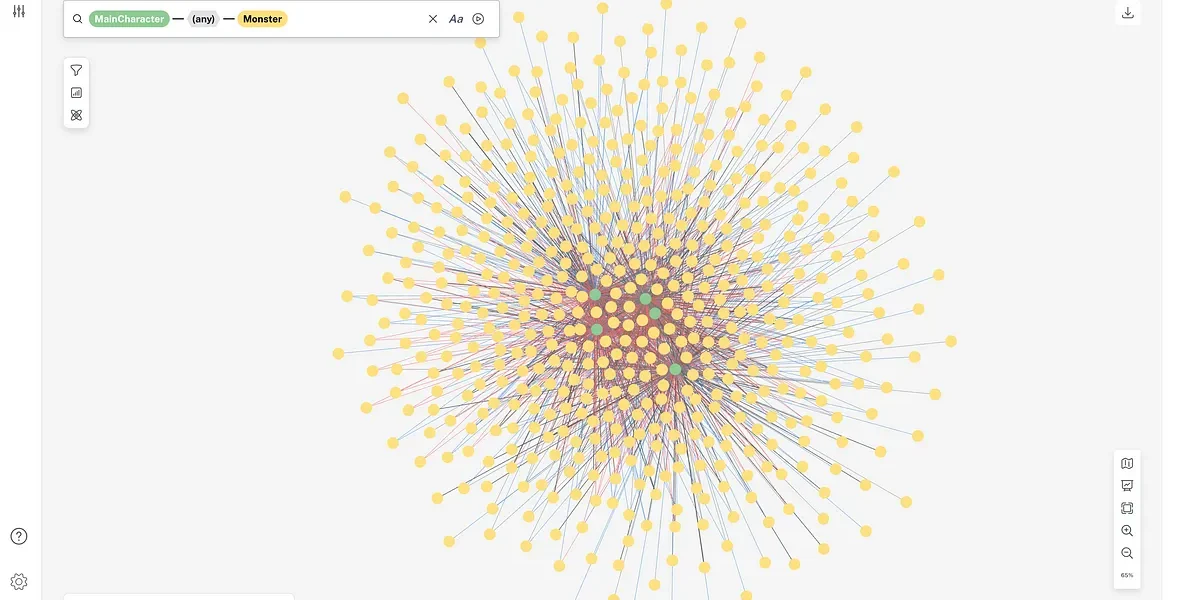
Best Overall Graph Visualization:
My entry for @GraphConnect #ShowMeYourGraph https://t.co/sdWfKwhbii pic.twitter.com/MPqSAPFqcO
— swainjo (@swainjo) September 30, 2014
Click here to read how John collected Twitter data tagged with “ebola” to analyze key influencers in the network based on retweets.
Interested in Graph Visualizations? Come to GraphConnect 2014 SF to hear firsthand from Neo4j’s Graph Visualization partners like Cambridge Intelligence, Tom Sawyer Software, Linkurious and GraphAlchemist how to implement graph visualizations into your business.
 GraphConnect is the only conference focusing on the rapidly growing world of graph databases and applications. Learn from hot startups and Global 2000 companies how they use Neo4j to power their businesses. Join over 700 graphistas from around the world to discuss best practices and lessons learned in the San Francisco on October 22, 2014.
For more information and registration, visit www.graphconnect.com.
Want to learn more about graph databases? Click below to get your free copy of O’Reilly’s Graph Databases ebook and discover how to use graph technologies for your application today.


