Geospatial Indexing US Congressional Districts with Neo4j-spatial

Developer Relations Engineer
8 min read
In this post I will show you how we can use geospatial indexing with Neo4j.
We will extend the legis-graph dataset (a graph of US Congress), adding US Congressional districts to the graph. We will use neo4j-spatial, a plugin for Neo4j, to index the geometries of the Congressional districts. Finally, I will show how we can connect Neo4j to Mapbox, a mapping framework, to make an interactive geographical visualization in the browser.
Let’s get started!
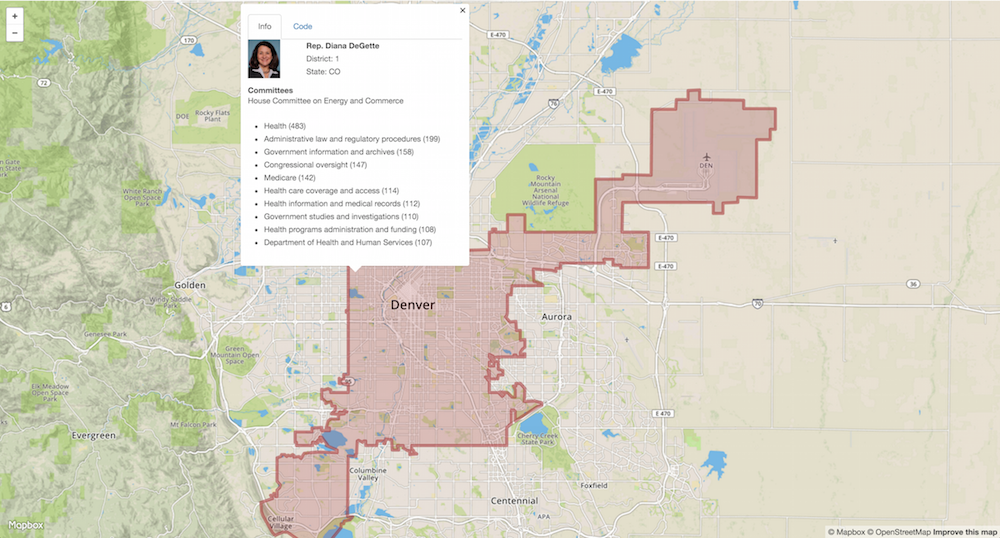
Figure 1: legis-graph-spatial: An interactive map visualization using Neo4j and Mapbox.
Overview of legis-graph
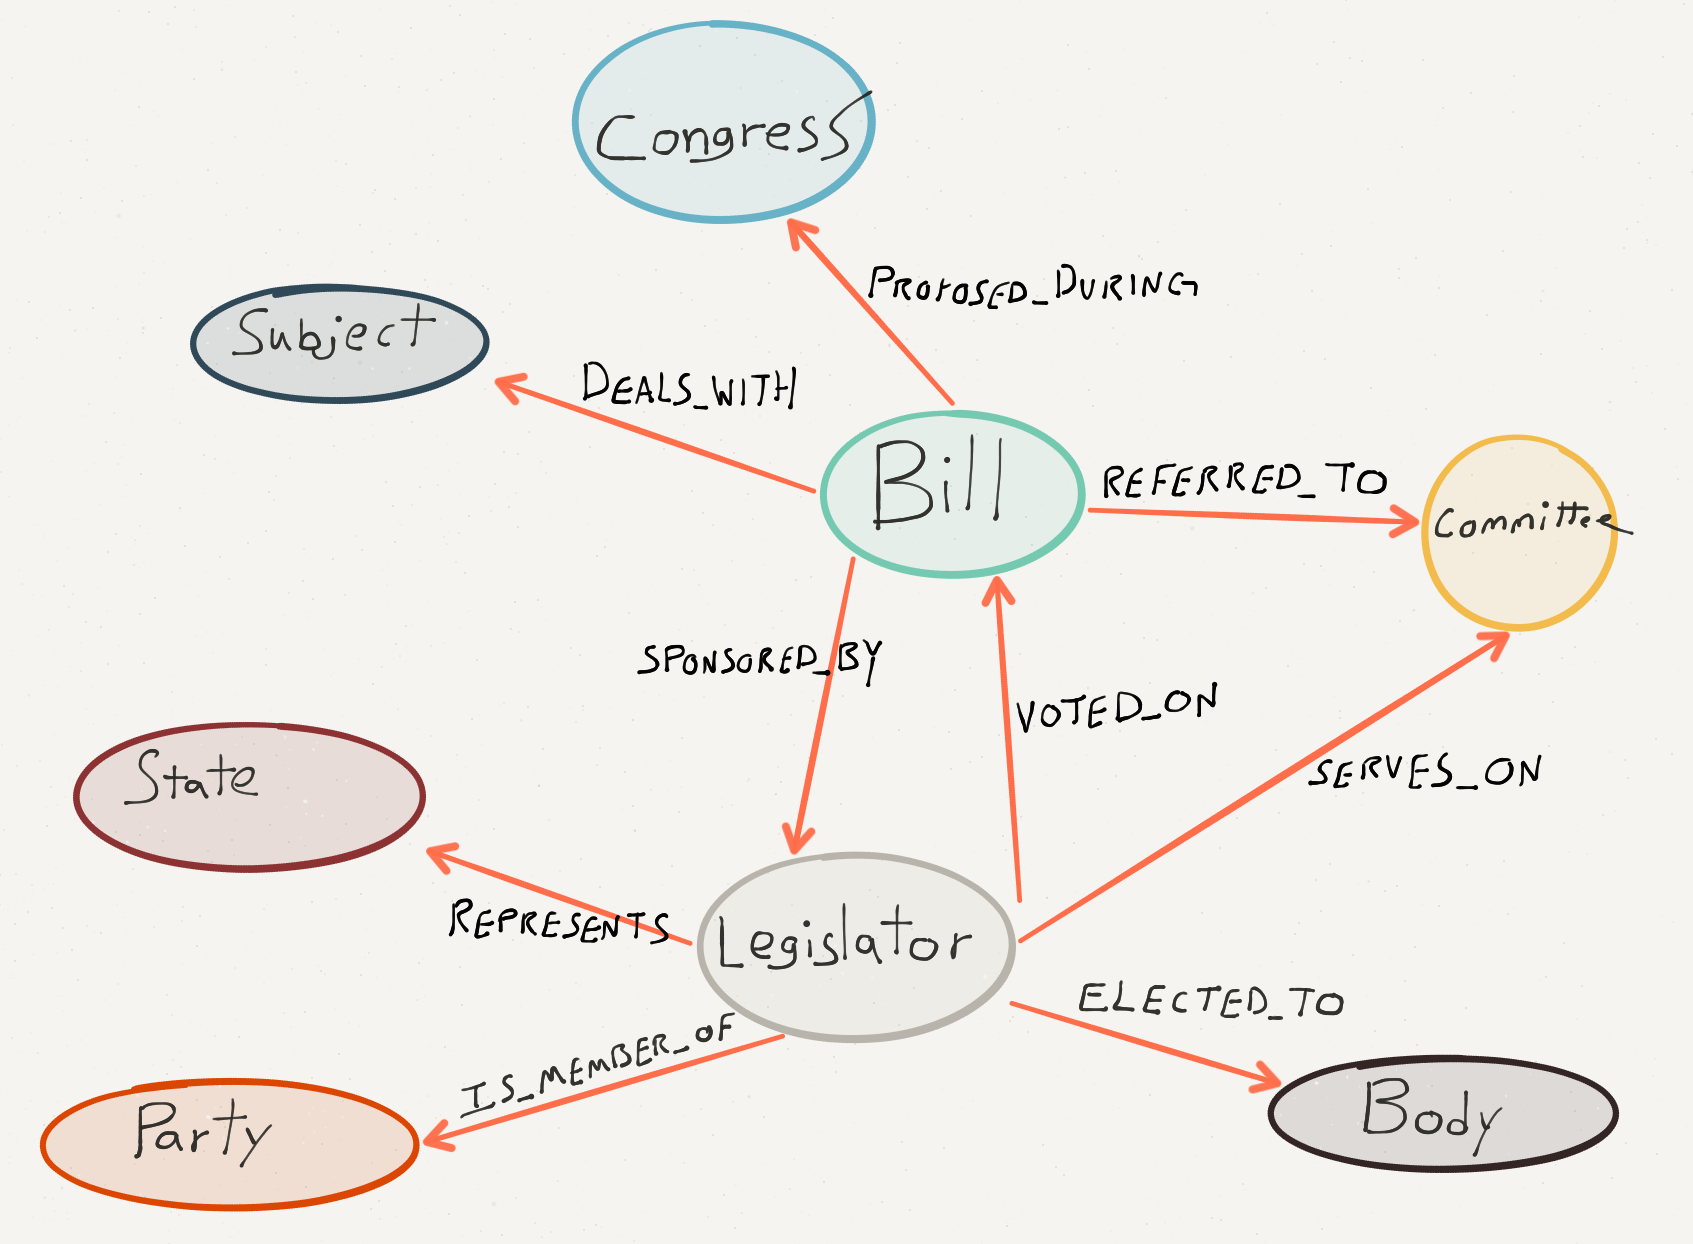
Figure 2: The legis-graph data model. This dataset describes the activities of US Congress. The data comes from govtrack.us.
Legis-graph is a dataset that models US Congress as a graph. After all, US Congress is a collaboration network and should be modeled as such.
By modeling the data as a graph in Neo4j, we can write powerful graph traversal queries to answer questions like “What are the topics of bills certain legislators are sponsoring?” and “Who is the most influential Senator in Congress with influence over certain topics?”.

Figure 3: An example of a query of the legis-graph dataset. Legislators who represent California by party and congressional body.
If you’d like to experiment with legis-graph in Neo4j there is a read-only Neo4j instance online available here.
An Interactive Map Visualization Using Neo4j and Mapbox
There are many dimensions to explore in this dataset, but I wanted to do more with the spatial component. We have state nodes in the graph, but I wanted some way to interactively explore the data using a map.
As I was preparing my presentation for the NICAR data journalism conference this year, I took the opportunity to extend legis-graph and build a simple interactive map interface that enables querying legis-graph based on spatial geometries (Congressional districts) and visualizing the results as part of the map.
You can try the initial version here – just click anywhere in the US to get started. I have lots of plans for adding additional functionality, so stay tuned for updates!
Overview of neo4j-spatial
The first component we need for this project is some way to index geometries in the database and a method for querying those geometries. Enter neo4j-spatial! Neo4j-spatial is a Neo4j plug-in that facilitates geospatial operations on data stored in Neo4j. Among other operations, it enables indexed geospatial queries by implementing an R-tree, in this case in the graph because an R-tree is itself a graph.
There are several great examples and blog posts out there that show how to index and query point (X,Y) geometries, like points of interest, but here we are dealing with more complex polygon geometries (Congressional districts). No worries, neo4j-spatial supports these more complex geometries using the WKT, or Well Known Text format!
Adding Congressional Districts to legis-graph
Neo4j-spatial allows us to index nodes that contain vector geometries specified as properties on the nodes. In this case we need to extend the legis-graph data model to include District nodes and store their geometry as a string property in WKT format.
The geometries of each congressional district are available here as shapefiles. Once we’ve downloaded the files, we need to read the geometries of each district and convert to WKT format. There are many tools available that can do this but I used the PyShp Python library to do this and wrote them to a CSV file to be used during the import process for legis-graph.
The legis-graph Data Model, with Districts
One of the benefits of the graph data model is the ability to transform the data model easily as our requirements change. Previously, we had a direct REPRESENTS relationship from the Legislator node to the State node. Now that we have more fine-grained data (Congressional districts), we can easily extend the data model by creating District nodes and updating our relationships in the graph:

Figure 4: Adding District nodes to the graph. The geometry of each district is stored as a string property on the node in WKT format.
Creating and Adding Nodes to the Spatial Layer
Now that we’ve stored the Congressional geometries in the graph we need to tell neo4j-spatial to add these nodes to the spatial index. We can do this by making a series of HTTP REST requests to the Neo4j server (once we’ve installed neo4j-spatial).
Create the layer
First, we’ll make an HTTP request to create a WKT layer:
POST https://localhost:7474/db/data/ext/SpatialPlugin/graphdb/addEditableLayer

Accept: application/json; charset=UTF-8

Content-Type: application/json

{
  "layer" : "geom",
  "format" : "WKT",
  "nodePropertyName" : "wkt"
}
From the neo4j-spatial documentation, create a WKT layer.
Add Nodes to the Layer
Now that we’ve created it, we need to add our District nodes to the spatial layer. We can do this using another HTTP request:
Example request

POST https://localhost:7474/db/data/ext/SpatialPlugin/graphdb/addNodeToLayer

Accept: application/json; charset=UTF-8

Content-Type: application/json

{
  "layer" : "geom",
  "node" : "https://localhost:7575/db/data/node/54"
}
From the neo4j-spatial documentation, add a node to the layer.
As I mentioned earlier, neo4j-spatial uses an in-graph RTree index. We can see how the graph updates once we start adding nodes to the layer:
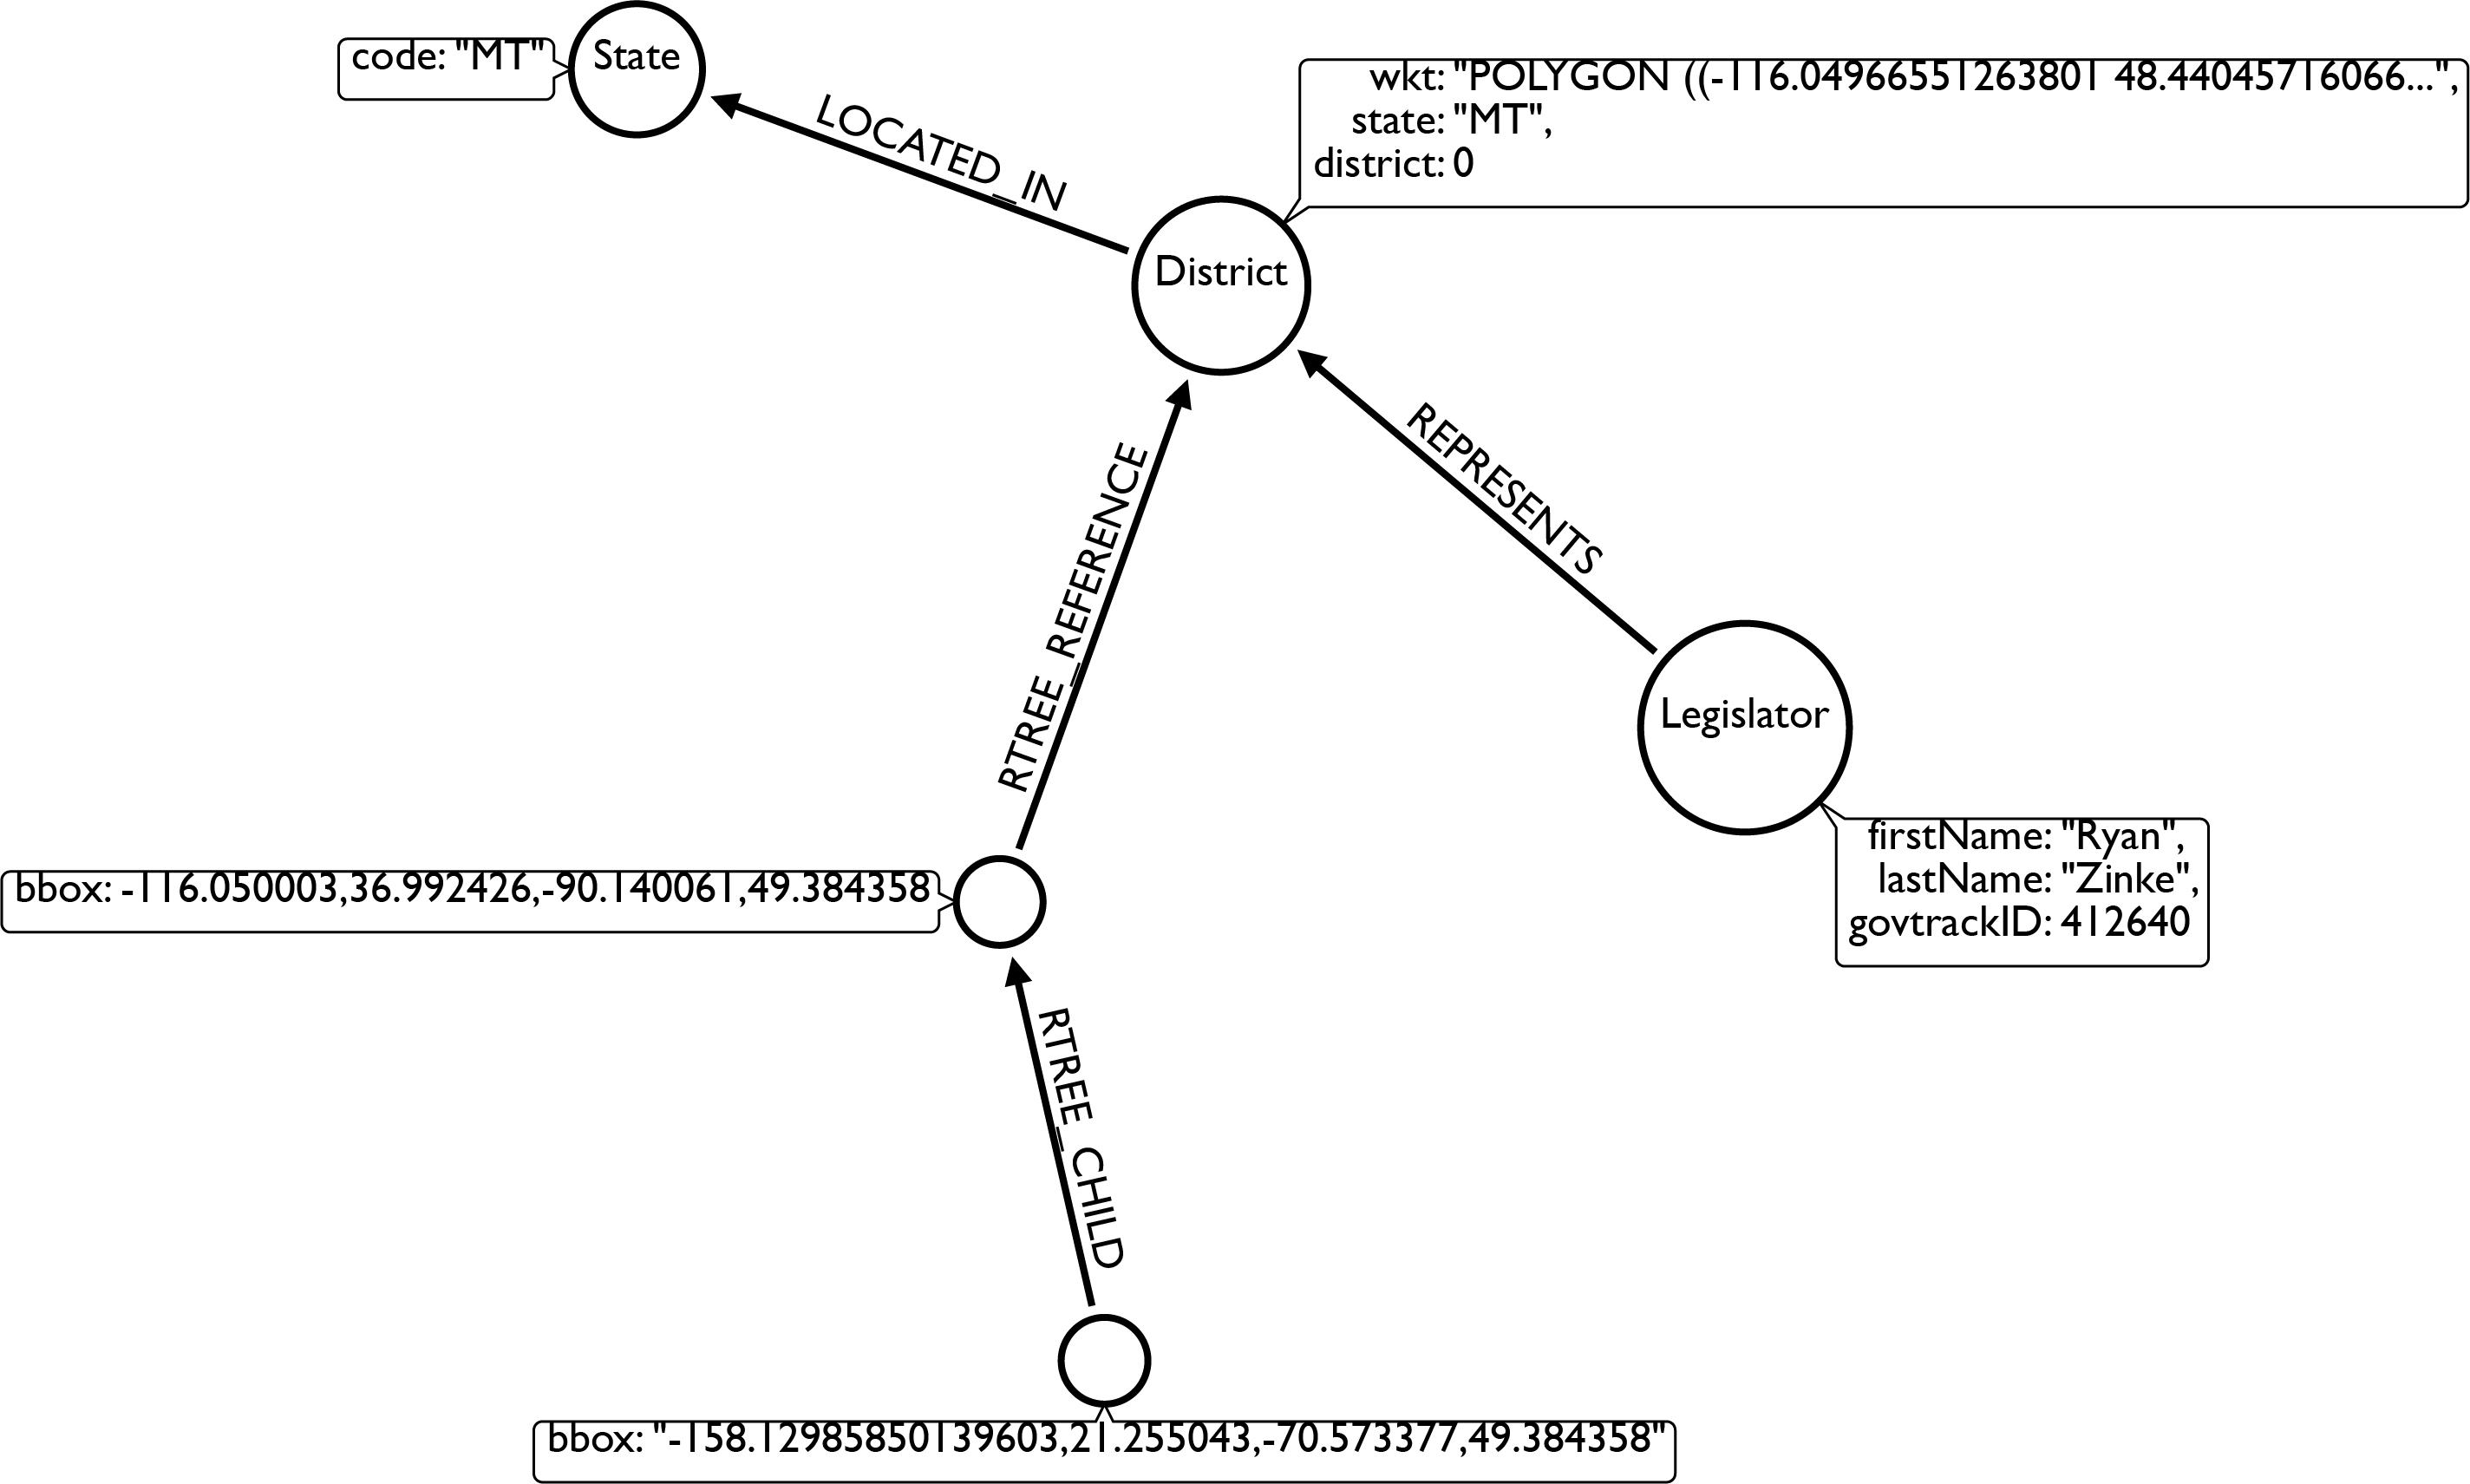
Figure 5: Data model after creating the in-graph index.
I wrote a simple Python script to iterate over the District nodes that had not yet been indexed and add them to the spatial layer:
import requests
from py2neo import Graph

# A Neo4j instance with Legis-Graph
graph = Graph("https://52.70.212.93/db/data")
baseURI = "https://52.70.212.93"

# this function will add a node to a spatial layer
def addNodeToLayer(layer, nodeId):
    addNodeToLayerParams = {"node": baseURI+ "/db/data/node/" + str(nodeId), "layer": layer}
    r = requests.post(baseURI + "/db/data/ext/SpatialPlugin/graphdb/addNodeToLayer", json=addNodeToLayerParams)

# Find District nodes that have wkt property and are not part of the spatial index.
# Add these nodes to the layer
getIdsQuery = "MATCH (n:District) WHERE has(n.wkt) AND NOT (n)-[:RTREE_REFERENCE]-() RETURN id(n) AS n"
results = graph.cypher.execute(getIdsQuery)
for record in results:
    nodeId = record.n
    addNodeToLayer("geom", nodeId)
This Python snippet queries the graph for nodes that have not yet been added to the spatial index and makes a REST request to add them to the index.
Querying for Closest District
Now that we have our geospatial data indexed in the graph we need some way to query it! Again we’ll use an HTTP request to the REST API that neo4j-spatial exposes:
Example request

POST https://localhost:7474/db/data/ext/SpatialPlugin/graphdb/findGeometriesWithinDistance

Accept: application/json; charset=UTF-8

Content-Type: application/json

{
  "layer" : "geom",
  "pointX" : 15.0,
  "pointY" : 60.0,
  "distanceInKm" : 100
}
From the neo4j-spatial documentation, finding geometries within distance of a point.
Integrating with Mapbox
Now it’s time to bring in our map. We want to allow our user to click somewhere on the map, find the closest Congressional district and query legis-graph for information about that legislator, including the Committees on which they serve and the topics of bills referred to those committees. This will give us some idea of the topics over which that legislator has influence.
We’ll use the awesome Mapbox JS API for our map. Mapbox allows us to embed an interactive map in our web page and provides functions for interacting with the map. In our case the specific features we’re interested in are responding to clicks on the map and annotating the map by drawing polygons and popups.
The first step, after including the Mapbox library is to define the map object and specify a click handler function that is called when a user clicks the map:
L.mapbox.accessToken = MB_API_TOKEN;
var map = L.mapbox.map('map', 'mapbox.streets')
  .setView([39.8282, -98.5795], 5);

map.on('click', function(e) {
  clearMap(map);
  getClosestDistrict(e);
});
Create the map and define a click handler for the map.
Here getClosestDistrict is a function that will take the latitude and longitude of the mouse click and make a request to the /findGeometriesWithinDistance endpoint exposed by the neo4j-spatial plugin to find the closest Congressional district, then executes a Cypher query to find the committees, bills and bill subjects that legislator has overseen in their committees.
/**
  *  Find the District for a given latlng.
  *  Find the representative, commitees and subjects for that rep.
  */
function infoDistrictWithinDistance(latlng, distance) {

  var districtParams = {
    "layer": "geom",
    "pointX": latlng.lng,
    "pointY": latlng.lat,
    "distanceInKm": distance
  };

 var districtURL = baseURI + findGeometriesPath;
 makePOSTRequest(districtURL, districtParams, function (error, data) {

   if (error) {
    console.log("Error");
   } else {
    console.log(data);

   var params = {
    "state": data[0]["data"]["state"],
    "district": data[0]["data"]["district"]
   };

   var points = parseWKTPolygon(data[0]["data"]["wkt"]);

   makeCypherRequest([{"statement": subjectsQuery, "parameters": params}], function (error, data) {

    if (error) {
      console.log("Error");
    } else {
      console.log(data);

      var districtInfo = data["results"][0]["data"][0]["row"][0];
      districtInfo["points"] = points;
      districtInfo["state"] = params["state"];
      districtInfo["district"] = params["district"];
      console.log(districtInfo);

      addDistrictToMap(districtInfo, latlng);
    }
   });
 }
});
We also return the WKT string that defines the district geometry so that we can annotate the map with a polygon for the district. However, we need to parse that from a WKT string into an array of points:
/**
 *  Converts Polygon WKT string to an array of [x,y] points
 */
function parseWKTPolygon(wkt) {
  var pointArr = [];
  var points = wkt.slice(10, -3).split(",");

  $.each(points, function(i,v) {
    var point = $.trim(v).split(" ");
    var xy = [Number(point[1]), Number(point[0])];
    pointArr.push(xy)
  });

  return pointArr;
}
Another useful utility function that we define uses the jQuery ajax function and the Neo4j transactional Cypher HTTP endpoint to execute a parameterized Cypher statement:
/**
*  Run a Cypher query
*/
function makeCypherRequest(statements, callback) {

  var url = baseURI + "/db/data/transaction/commit";

  $.ajax({
    type: 'POST',
    data: JSON.stringify({
      statements: statements
    }),
    contentType: 'application/json',
    url: url,
    error: function(xhr, statusText, errorThrown){
      callback("Error", null);
    },
    //headers: authHeader(), // add basic headers if necessary
    success: function(data) {
      console.log(data);
      callback(null, data);
    }
  });
}
Once we’ve gotten the data back from Neo4j and parsed the WKT into an array of points we can annotate the map:
Annotating the Map
/**
 *  Add District polygon and legislator popup to map
 *
 * @param data
 * @param latlng
 */
function addDistrictToMap(data, latlng) {
  polygon_points = data["points"];

  popuptext = buildPopup(data);

  var polyline = L.polygon(polygon_points, {color: 'brown'}).addTo(map);
  map.fitBounds(polyline.getBounds());

  var popup = L.popup({keepInView: true, minWidth: 350, maxWidth: 1000});
  popup.setLatLng(latlng)
    .setContent(popuptext)
    .openOn(map);
    popup.update();
}
Once we have it running it looks like this:

Legis-graph-spatial demo. Try it here.
There are a few portions of the code that I didn’t go over, such as building the map popup, but all code is available in this GitHub repository.
Want to learn more about graph databases? Click below to get your free copy of O’Reilly’s Graph Databases ebook and learn how to use graph technology in your next app or project.
Share Article


Explore
Related Articles


Integrating Neo4j With Symfony: Profiling Queries and Centralized Logging

Integrating Neo4j With LangChain4j for GraphRAG Vector Stores and Retrievers