Graph algorithms for cybersecurity: A picture is worth 1,000 rows

Co-Founder & CEO, Uplevel Security
14 min read

Editor’s note: This presentation was given by Liz Maida at Connections 2021.
At Uplevel, a cybersecurity company, we apply graph query machine learning to enhance the effectiveness and efficiency of security operations teams. “A Picture Is Worth 1,000 Rows” really encapsulates one of the core advantages that graphs can provide in cybersecurity. Many times security analysts are stuck reviewing thousands of rows and are trying to find the connections between those rows entirely based on their own experience.
In this blog, I will share some background on how graph algorithms can help automate that process.
Security teams are overwhelmed with data
People tend to believe that security is a very technically sophisticated domain, so I wanted to share the reality of the matter. Similar to other industries, there is an overabundance of data.
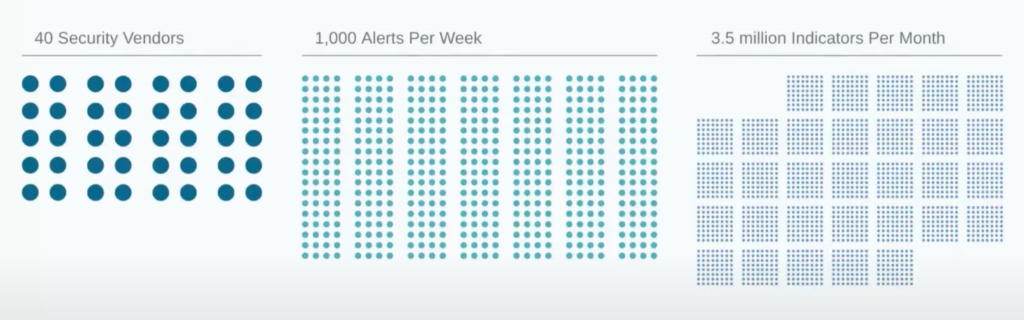
The average large enterprise usually has over 40 security vendors across the network and endpoint devices. Those vendors are generating over 1,000 alerts per week. To further compound this data problem, the organizations are also receiving millions of pieces of threat intelligence or rules about what should be considered malicious. In the average large enterprise, more than 90% of this security data is thrown away.
The top question that security teams are dealing with is: How does this alert relate to anything we’ve seen in the past, and is this actually an indication of malicious activity? Due to resource constraints, it’s impossible to investigate everything. Organizations are still largely depending on humans spending 16 plus hours investigating an alert and coming to some conclusion about whether it actually represents malicious activity. You may be wondering what security analysts do during this time.
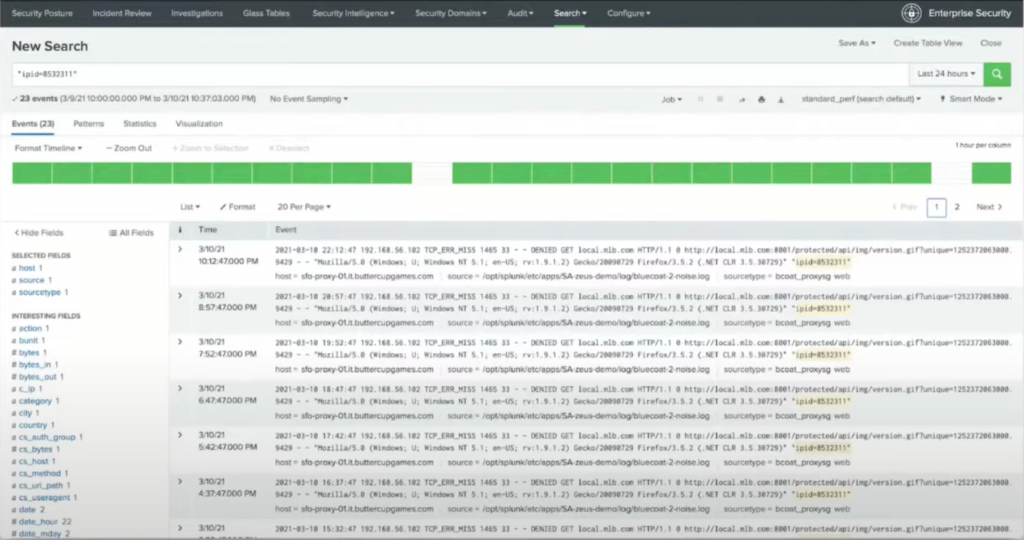
An analyst will copy and paste values from an alert to create a series of searches, using the results from a previous search to inform the next search. Usually they’re searching through something like Splunk, which is the example in the image above, or it could be a data lake or database.
Security typically looks at the SIEM (Security Information and Event Management) systems. You can think of it as a large collection of logs. Security analysts will then check random websites, search through emails, and compare their results against spreadsheets, ultimately enriching the information that exists in the SIEM with this open source data. In some cases, the analyst may actually write down the results on paper, almost creating their own directed graph based on their search history.
Since this is such a manual, time-consuming effort, organizations will create and save frequently used searches in advance. These searches are often designed to flag suspicious activity, such as an unusual number of requests from the same IP within a limited timeframe. In order to write these searches, you need to have an idea of what you’re looking for.
Teams meet to identify the activity they would consider to be malicious and confirm if the data actually exists in the log store, before writing these correlation searches and essentially creating rules-based heuristics. When something matches these conditions, it triggers an alert similar to the other alerts, but based on more complicated logic.
Some of these rules are written by the security team within the organization itself, and some are actually pre-packaged and provided by the vendor who develops the SIEM. You end up with hundreds of rules from different creators, which can create a huge maintenance burden.
It’s a really time-consuming, manual effort to create and analyze the effectiveness of the rules, especially if you weren’t the one who originally authored them. There’s also a lot of complexity as you end up with many potentially overlapping rules with different priorities, and so trying to sort through which rule actually applies in a certain circumstance is an incredibly challenging endeavor.
After you go through all the effort of creating and managing these correlation services, you end up with a dashboard, like the one below.
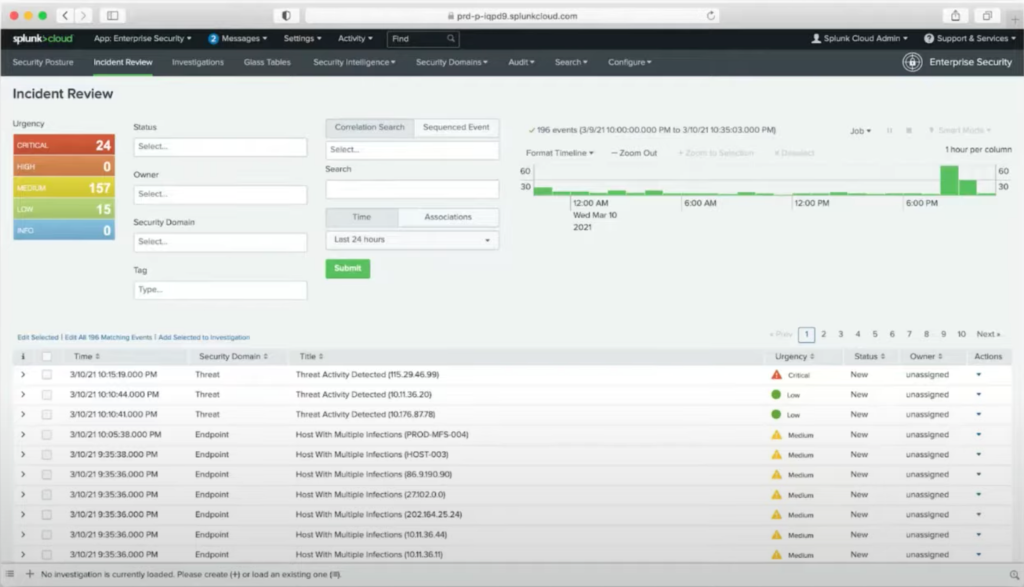
The security analyst has to pick something to investigate based on their general instincts about what looks malicious. There are still these inherent limitations in how you determine if these different rules are actually related. While some rules may have been combined as a result of correlation search, it’s only because you already knew that the underlying activity indicated malicious behavior.
Graphs can provide visual indications of activity requiring investigation
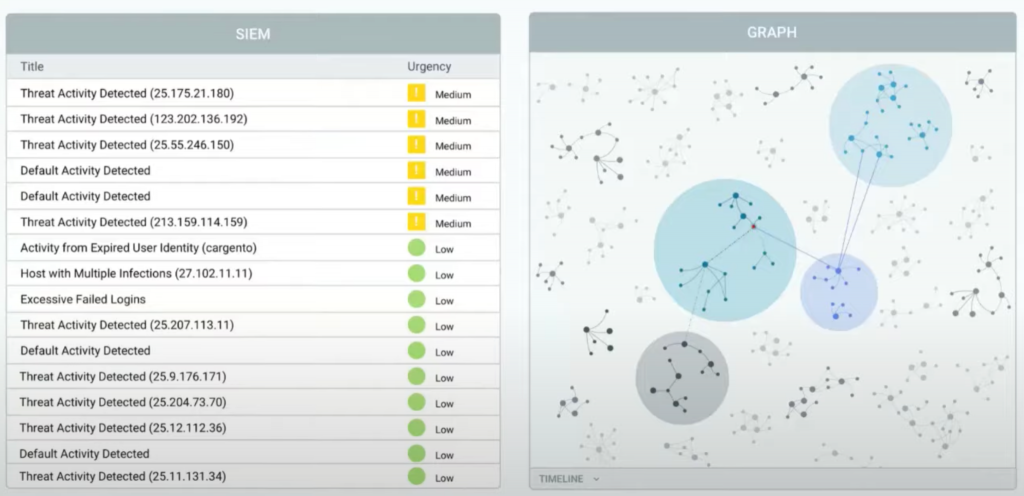
Graphs can help with security, not just in terms of visualizing the data, but also analyzing the underlying data. With a graph representation, an analyst can immediately see the clusters of correlated alerts, like in the image below. It should ultimately be investigated as a single unit or as related to significant past events.
Graph algorithms can identify potentially malicious activity
Graph algorithms, such as community detection, can effectively replace the need to write and manage hundreds of correlation rules. There are multiple situations that actually result in having all of these disparate pieces of information connected about the same attack and would warrant the use of graph algorithms. You might have alerts about the underlying event coming from multiple different devices.
A great example of this is on your laptop; you may have antivirus software, Microsoft Defender, and endpoint detection and response all running at the same time. If something bad is happening on your laptop, all of those different pieces of software might actually flag it.
You might also have situations where there are sequential events that are all related to an ongoing attack. A denial-of-service is a fairly straightforward example. It’s really the same activity that’s occurring, but it’s being repeated over an extended period of time. You may have multiple alerts flagging the exact same tactic by the same threat actor. A phishing email campaign is a very common example of this, where you have multiple versions of a very similar email sent to different recipients.
Alerts data
Finally, you may have a variety of alerts that actually constitute a progressing attack or attack vector. You might see a phishing email that’s followed by some registry edits, and then some unusual outbound traffic. In that case, you actually have a lot of the evidence in your log data store. The challenge is figuring out which pieces of data are actually related and constitute that attack vector.
Before we get into more detail about how graph algorithms can be applied, I wanted to quickly provide a highlight of the data that we’re dealing with and introduce some terminology.

This is an alert. You can think of it as an event that’s triggered by a security product because there was some type of activity that matched one of the predefined rules defining that behavior. Within these alerts, there are a lot of individual technical attributes or characteristics. This individual field, such as the file hash, is an attribute of a file. The final term that I think that would be useful to highlight is indicator. An indicator is a piece of intelligence indicating that a specific attribute or group of attributes identifies malicious behavior.
Community detection algorithms
Community detection algorithms help identify related alerts.
Community detection algorithms are focused around identifying related clusters of nodes that naturally occur within the graph. In the case of cybersecurity, a cluster of nodes is a set of related alerts that should be investigated as a single unit, as they’re likely to all be pieces of evidence in the same or related attacks.
There are different types of community detection algorithms: clustering coefficients, connected components, and label propagation. A great resource is the book, Graph Algorithms: Practical Examples in Apache Spark and Neo4j, which provides a lot more detail on community detection algorithms and sample implementations.
In our case, much of our work is focused on connected components and finding those groups of related alerts.

In the image above, you can see some sample queries using Neo’s union-find algorithm, which helped us identify the connected components. We built upon the results of the union-find algorithm to get a list of the actual components or partitions that were a result of that algorithm.
That way, we can get an idea of the number, size, and density of these partitions. The relevance of the number of nodes in each partition versus the number of alerts were really helpful areas for us to guide investigations for security analysts.
Essentially, we’re breaking this larger graph into smaller subgraphs before identifying which subgraphs are worth further investigation. We found with cybersecurity teams that it was really helpful for them to look at both the visual representation and the written details of the alerts and attributes within the cluster.

As you can see in the image above, we pair the visual representation of the individual clusters with those written details and allow people to navigate through to see what information actually constitutes the various clusters. Ultimately, if an analyst determined that a particular cluster really did warrant further investigation, they could then send all of the details of the associated events to a Jira or a ServiceNow and officially start an investigation.
Pre-processing the graph for community detection
Now I will go into a little more detail on our clustering approach, as it’s not quite as straightforward as simply identifying groups that are all connected within the graph.
We actually introduced some enhancements by pre-processing the graph prior to applying community detection algorithms. I think this is a common approach that you see in terms of applying such algorithms. In our case, there were exact attribute matches that you can see when looking at the graph, but there were also some heuristic attribute matches that we introduced, which are specific to the security data. This is a great example of domain knowledge about the data itself. The graph can really allow you to optimize how you apply the algorithms.
We thought of these as equivalence detection modules, specific to each attribute type. For example, we would check for shared subnets between IP addresses or shared prefixes for file paths. We also have more advanced modules using text similarity algorithms, like edit distance, longest common substring analysis, and apply NLP techniques such as named entity extraction for email bodies. It was really based upon the different attribute types and different techniques that provide enhanced knowledge.

In the example above, we’re highlighting two nodes that are each representing an attribute, but they’re not actually the exact same node because the file names are slightly different. They just happen to match a general pattern that we’ve identified based upon our text analysis.
We can then enhance the scoring of these equivalent attributes based on temporal dynamics, event categories, and the role of the attributes within the events. You can really think of this as scoring the relationships between certain nodes. Even though everything might appear connected visually, our clustering algorithms might identify a subset of a visually connected component as something that’s actually related. There is an example of this on the right-hand side of the image below. Only a subset of that overall cluster has been identified as a set of related alerts due to malware activity.

Centrality algorithms prioritize alert clusters
We also use another class of algorithms, centrality algorithms, to help prioritize these alert clusters. You first do automated clustering to find the related alerts within the graph, but then it becomes an issue of just because something is a partitioned subset of the overall graph, that doesn’t necessarily mean it warrants an investigation.
So, centrality algorithms really focus on the number and nature of connections. They’re very much related to the fundamental graph topology and can include degree, the number of connections, nodes that have the most control over the flow between different nodes and groups, and page rank.
In order to prioritize the clusters and help guide the security team in terms of which events to focus on, we will use parameters on individual nodes, as well as apply centrality algorithms to determine the importance of distinct nodes within the cluster.

If a cluster contains alerts or information from a highly trusted source, meaning they have a very good reputation in terms of having minimal false positives, the cluster could be assigned a higher priority; this is because it’s considered far more likely to be a truly significant event. However, there might be other information that’s indicative of benign activity, and so that cluster is actually deprioritized accordingly.
Pre-processing can identify new indicators
An exciting by-product of this analysis, specifically some of the text pre-processing, can help dynamically generate new intelligence that can be used to proactively identify attacks. I mentioned indicators earlier in the presentation, which are the technical characteristics that have been flagged for being indicative of malicious activity.
There are a lot of reports publicly available that talk in more detail about threat actors and the known indicators that are indicative of their presence or involvement in an attack. In the image below, I have an example of a report that was recently published by FireEye, which covers APT41 (Advanced Persistent Threat 41). APT41 is a threat actor involved in both state-sponsored activity and its own cybercrime operations, which target a variety of industries – everything from healthcare and high-tech media, to retail and telecom.
I highly recommend taking a look at the FireEye report or other reports to get an idea of the level of research and effort that goes into uncovering the tactics, techniques, procedures, and indicators associated with these threat actor groups.

As you can see from this example, there are some indicators that you might get in the file hashes and the domains that are presented. Those file hashes, domains, and related indicators can be used in either the security products themselves to generate alerts, or in the SIEM correlation searches. The challenge is that these indicators are always shifting.
Graph analysis, specifically the combination of similarity analysis and community detection to identify related alerts, can uncover these potential indicator patterns. Many of the indicators that are the output of the graph analysis are actually broader than the indicators listed here, because graph analysis can generalize multiple indicators into regular expression patterns.
Another advantage of doing this automated analysis is that the indicators can require updates far more dynamically and capture the very latest information without having to involve huge research teams. This is not to say that you would want to do all of your indicator analysis in an automated manner, but it can really help enhance the work that an independent threat research team is doing.
Additional opportunities for graph algorithms in cybersecurity
We’ve focused a lot on community detection and centrality algorithms, as well as how text similarity analysis can enhance both of those. There are a number of other opportunities for graph analysis and graph algorithms within cybersecurity.
One of the main opportunities is around creating attack pattern fingerprints, so that you can look for the subgraph patterns within a larger graph. You can look for subgraph isomorphism, where you’re really looking for the pattern of nodes, relationships, labels, properties, and potential directionality to find those patterns elsewhere in the graph. You can also apply label propagation to cascade maliciousness throughout the graph. If something seems malicious and is closely connected to another attribute, that can increase the likelihood that that attribute is malicious.
As you can see, it’s not quite as straightforward as just assuming that everything that is connected is also malicious. There is related work around statistical relational learning, where you use graph topology to predict a level of confidence of what the label should be on related nodes.
Finally, you can also use centrality algorithms to analyze the tactics, techniques, and procedures across different attackers and threat actor groups. You can identify the most common techniques or the ones that are most indicative of sophisticated, targeted activity to potentially find related threat actor groups.
Conclusion
There is so much value in the applications of graph algorithms to cybersecurity, especially for the teams that are focused on the threat intelligence research work. I hope this blog provided some examples of how graph algorithms, including community detection and centrality algorithms, can help identify and prioritize related security alerts.
Share Article


Explore
Related Articles
Neo4j Named “One to Watch” in Snowflake’s 2026 Modern Marketing Data Stack Report

SumoDB in Neo4j: Chaining Multiple Graph Algorithms in Snowflake — Part 3


