Graph algorithms in Neo4j: The power of graph analytics


4 min read
According to Gartner, “graph analysis is possibly the single most effective competitive differentiator for organizations pursuing data-driven operations and decisions.”
Why did Gartner say this? Because graphs are the best structure for today’s complex and ever changing data, and if you can analyze them at scale and uncover key patterns and trends, you will uncover numerous opportunities that others will miss.
In this series on graph algorithms, we explain how using Neo4j Graph Analytics empowers organizations to make new discoveries and develop intelligent solutions faster.
Last week we kicked off this extensive series by explaining why we are so passionate about graph algorithms, and why you should be, too. This week we’ll delve a bit into network science and its many applications – and how graph algorithms unlock the information in complex networks.
In the coming weeks, we’ll cover the rise of graph analytics and increasingly dive deeper into the practical applications of graph algorithms, using examples from Neo4j, the world’s leading graph database.
Network science & the rise of graph models
Networks are a representation, a tool to understand complex systems and the complex connections inherent in today’s data. For example, you can represent how a social system works by thinking about interactions between pairs of people.
By analyzing the structure of this representation, we answer questions and make predictions about how the system works or how individuals behave within it. In this sense, network science is a set of technical tools applicable to nearly any domain, and graphs are the mathematical models used to perform analysis.
Networks also act as a bridge for understanding how microscopic interactions and dynamics lead to global or macroscopic regularities as well as correlate small scale clusters to a larger scale element and shape projection.
Networks bridge between the micro and the macro because they represent exactly which things are interacting with each other. It’s a common assumption that the average of a system is sufficient because the results will even out. However, that’s not true.
For example, in a social setting, some people interact heavily with others while some only interact with a few. An averages approach to data completely ignores the uneven distributions and locality within real-world networks.

Transportation networks illustrate the uneven distribution of relationships and groupings. Source: Martin Grandjean
An extremely important effort in network science is figuring out how the structure of a network shapes the dynamics of the whole system. Over the last 15 years we’ve learned that for many complex systems, the network is important in shaping both what happens to individuals within the network and how the whole system evolves.
Graph analytics, based on the specific mathematics of graph theory, examine the overall nature of networks and complex systems through their connections.
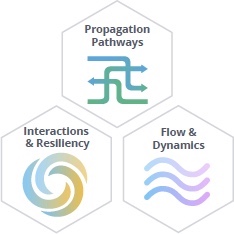
With this approach, we understand the structure of connected systems and model their processes to reveal hard-to-find yet essential information:
- Propagation pathways, such as the route of diseases or network failures
- Flow capacity and dynamics of resources, such as information or electricity or
- The overall robustness of a system
Understanding networks and the connections within them offers immense potential for breakthroughs by unpacking structures and revealing patterns used for science and business innovations as well as for safeguarding against vulnerabilities, especially those unforeseen within the labyrinth.
The power of graph algorithms
Researchers have found common underlying principles and structures across a wide variety of networks and have figured out how to apply existing, standard mathematical tools (i.e., graph theory) across different network domains.
But this raises questions: How do people who are not mathematicians conversant in network science apply graph analytics appropriately? How can everyone learn from connected data across domains and use cases?
This is where graph algorithms come into play. In the simplest terms, graph algorithms are mathematical recipes based on graph theory that analyze the relationships in connected data.
Even a single graph algorithm has many applications across multiple use cases. For example, the PageRank graph algorithm – invented by Google founder Larry Page – is useful beyond organizing web search results.
It’s also been used to study the role of species in food webs, to research telomeres in the brain, and to model the influence of particular network components in just about every industry.
For example, in studying the brain, scientists found that the lower the PageRank of a telomere, the shorter it was – and there’s a strong correlation between short telomeres and cellular aging.

Conclusion
Graph algorithms play a powerful role in graph analytics, and the purpose of this blog series is to showcase that role. In our next blog, we’ll step back and look at the rise of graph analytics as a whole and its many applications in exploring connected data.
Learn about the power of graph algorithms in the O’Reilly book,
Graph Algorithms: Practical Examples in Apache Spark and Neo4j by the authors of this article. Click below to get your free ebook copy.
Share Article


Explore
Related Articles
Neo4j Named “One to Watch” in Snowflake’s 2026 Modern Marketing Data Stack Report

SumoDB in Neo4j: Chaining Multiple Graph Algorithms in Snowflake — Part 3


Why machines need embeddings: Turning graph structure into features