Graph algorithms in Neo4j: The rise of graph analytics


5 min read
According to Gartner’s 2018 Magic Quadrant for Data Management Solutions, the biggest reason for using the Neo4j graph database “is to drive innovation.”
This blog series is designed to help organizations better leverage graph analytics to effectively innovate and develop intelligent solutions faster.
This week we’ll trace the rise of graph analytics and answer the question, “Why now?” Part of the answer lies in the convergence of analytics with transactions, sometimes called “translytics.” In the coming weeks, we’ll dive deeper into the practical applications of graph algorithms, using examples from Neo4j, the world’s leading graph database.
The roots of graph analytics
Graph analytics has a history dating back to 1736, when Leonhard Euler solved the “Seven Bridges of Königsberg” problem. The problem asked whether it was possible to visit all four areas of a city, connected by seven bridges, while only crossing each bridge once. It wasn’t. With the insight that only the connections themselves were relevant, Euler set the groundwork for graph theory and its mathematics.

Source: Wikipedia
But graph analytics did not catch on immediately. Two hundred years would pass before the first graph textbook was published in 1936. In the late 1960s and 1970s, network science and applied graph analytics really began to emerge.
In the last few years, there’s been an explosion of interest in and usage of graph technologies. In 2017, Forrester survey data indicated that “69 percent of enterprises have or plan to implement graph databases within the next 12 months.” Demand is accelerating based on a need to better understand real-world networks and forecast their behaviors, which is resulting in many new graph-based solutions.
Why now? Forces fueling the rise in graph analytics
This growth in network science and graph analytics is the result of a combined shift in technical abilities, new insights and the realization that existing business intelligence systems and simple statistics fail to provide a complete picture of real-world networks. Several forces are driving the rise in graph analytics.
First of all, we’ve seen real-world applications of graph analytics and their impact on us all. The power of connected data for business benefit has been demonstrated in disruptive success stories such as Google, LinkedIn, Uber and eBay, among many others.
At the same time, digitization and the growth in computing power (and connected computing) have given us an unprecedented ability to collect, share and analyze massive amounts of data. But despite the masses of data they have, organizations are frustrated with the unfulfilled promises of big data and their inability to analyze it.
The majority of analytics used today handle specific, well-crafted questions efficiently but fall short in helping us predict the behavior of real systems, groups and networks. Most networks defy averages and respond nonlinearly to changes. As a result, more businesses are turning to graph analytics, which are built for connected data and responsive to dynamic changes.
In addition, there’s been a recognition of how graphs enhance machine learning and provide a decision-making framework for artificial intelligence. From data cleansing for machine learning to feature extraction in model development to knowledge graphs that provide rich context for AI, graph technology is enhancing AI solutions.
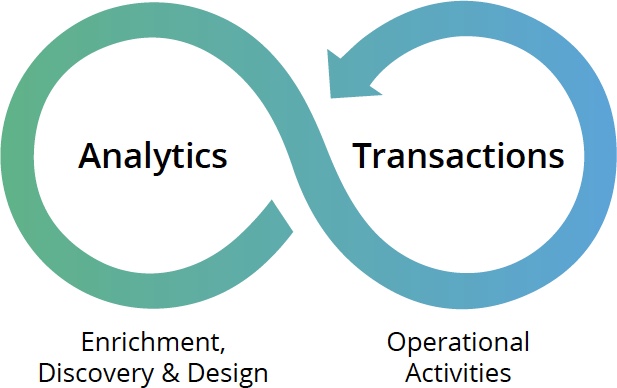
Bringing together analytics & transactions
Historically, the worlds of analytics (OLAP) and transactions (OLTP) have been siloed despite their interdependence (analytics drives smarter transactions, which creates new opportunities for analysis), which is especially true with connected data.
This line has been blurred in recent years and modern data-intensive applications combine real-time transactional queries with less time-sensitive analytics queries. The merging of analytics and transactions enables continual analysis to become ingrained in regular operations.
As data is gathered – from point-of-sale (POS) systems, from manufacturing equipment, from IoT devices, or from wherever – analytics at the moment and location support an application’s ability to make real-time recommendations and decisions. This blending of analytics and transactions was observed several years ago, and terms to describe this blurring and integration include “Transalytics” and Hybrid Transactional and Analytical Processing (HTAP).
“We need to combine transactional and analytic systems into transalytic systems and stop thinking about these as two separate systems. 2018 is going to be the year we’ll see major corporations collapse these two systems together, so that you have simplified architecture and can move at the pace of business.” – Bill Powell, Director of Enterprise Architecture,
Automotive Resources International (ARI)
“[HTAP] could potentially redefine the way some business processes are executed, as real-time advanced analytics (for example, planning, forecasting and what-if analysis) becomes an integral part of the process itself, rather than a separate activity performed after the fact. This would enable new forms of real-time business-driven decision-making process. Ultimately, HTAP will become a key enabling architecture for intelligent business operations.”– Gartner
Conclusion
Graph algorithms provide the means to understand, model and predict complicated dynamics such as the flow of resources or information, the pathways through which contagions or network failures spread, and the influences on and resiliency of groups.
Neo4j brings together analytics and transactional operations in a native graph platform, helping not only uncover the inner nature of real-world systems for new discoveries, but also enabling faster development and deployment of graph-based solutions with more closely integrated processing for transactions and analytics.
In the coming weeks, we’ll delve into the many use cases
graph algorithms support, from real-time recommendations to fraud detection and prevention.
Learn about the power of graph algorithms in the O’Reilly book,
Graph Algorithms: Practical Examples in Apache Spark and Neo4j by the authors of this article. Click below to get your free ebook copy.
Share Article


Explore
Related Articles
Neo4j Named “One to Watch” in Snowflake’s 2026 Modern Marketing Data Stack Report

Zero-Copy Graph Reasoning on Snowflake: Getting Started With Neo4j Virtual Graph

