Graph Data Science: The Secret to Accelerating Innovation with AI/ML

Senior Director of Product Management, Graph Data Science
14 min read
Editor’s note: This presentation was given by Alicia Frame at Connections: Accelerating Innovation with Graphs.
As Director of Data Science for Neo4j, I am excited to share how you can accelerate AI and machine learning innovation by using graph data science. While you can use queries to find what you know to look for, graph data science is all about uncovering what you don’t know to look for, understanding what’s going to happen next, and finding the patterns in your data that you just can’t sift through by hand.
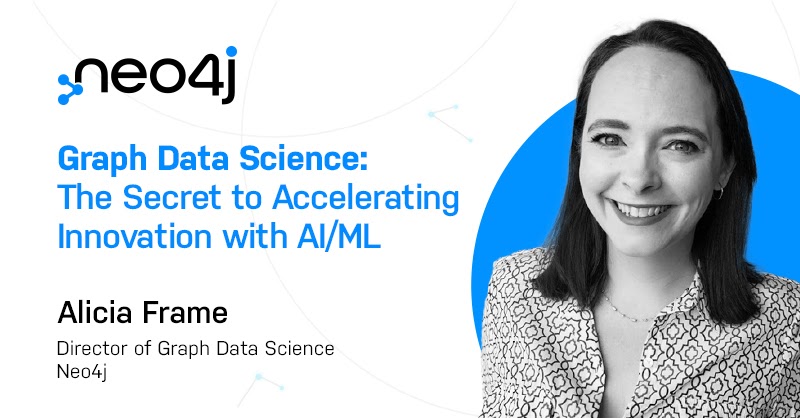
What’s a Graph?
When I’m referring to graphs, I’m talking about Neo4j’s labeled property graph, where we have nodes, which are basically nouns or entities.
In the example above, there are nodes for people and cars, and there are relationships that connect these nodes to each other:
Furthermore, you can have properties on the relationships or the nodes themselves. Graph data science is all about analyzing this connectivity in your graph.
Everything Is Connected
It’s important to understand that everything is connected. If you think about your data in an Excel spreadsheet, observations you’ve made, devices, or transactions, there are connections between your rows and columns.
You have social networks where you have networks of people who know each other. Graph data science in a social network might be used to figure out who is most likely to be your friend or who is most important.
Social networks evolve into transaction networks, where you can have people transferring money to other people, to banks, to merchants, buying items, returning items, etc. You see this in risk management, payments, or the supply chain, for example. As your data becomes more sophisticated and complicated, there are new discoveries to be made: Which items are likely to be returned? What item will someone buy next? Who is committing fraud and who is a victim of fraud? You can find some of these answers with queries, but graph data science helps you take the next step by finding what you don’t know to look for.
Knowledge graphs connect data together: heterogeneous concepts, people, places, things… really, any dataset you have. It could be your transaction network adding in information about the demographics of people and where they live. It could be fats, genes, chemicals, diseases. It’s a way of connecting all these disparate data points. Instead of having the data spread across numerous tables in your database, where you have to glue it back together, or in different Excel spreadsheets, that connected data lives in a connected shape that you can start to derive understanding from.
What’s really important to understand when we talk about innovation with graphs is that the graph structure is the network topology, how things are connected to each other, and what their connections are connected to. That structure is highly predictive. We often use the saying “It’s not what you know, but who you know” as a real example of network structures being highly predictive. It’s not your tabular data (where you studied, what you got a degree in, how many years of experience you have).
Instead, it’s that you knew the hiring manager, or your mentor introduced you to someone at a company. Those are connections. The structure of your network at your job (who you’re connected to, which projects you’re working on, and who your connections are connected to) is actually really predictive of who is going to get a raise or be promoted.
This predictivity goes for other social graphs as well. If you look at fraud, the structure of that transactional graph is a more predictive signal of who is going to commit fraud than all of your standard tabular data. In other words, the social graph, including whether or not you’ve transacted with fraudsters, or whether or not your connections have transacted with fraudsters, is more predictive than how much money was in a transaction or how many transactions were made. The PageRank of the transactions you’re making are all more predictive signals than any element of the tabular data.
Relationships Are Your Best Predictors
In any discipline, it’s not the numbers but the relationships behind the numbers that best predict outcomes. The structure of your graph is key to understanding what’s going on and what’s going to happen next. Connections are what drives your business. It’s not the numbers or the nouns.
You can have employees, citizens, customers, plants, warehouses, and suppliers. On their own, those are isolated concepts, but when you have relationships or connections between them, that’s when you can make sense of your data and understand what is driving outcomes. So, relationships are (and hopefully you’re buying into this by now) some of the strongest predictors of behavior.
If you want some fun reading on how relationships predict outcomes, I recommend Connected by James Fowler. Fowler provides this great example of predicting who is going to vote. Rather than looking at people’s age, what party they belong to, or where they live, looking at whether or not their friends and family vote and whether their friends and family’s friends and families vote is more predictive; it’s the network structure that’s predictive.
The same network structure is predictive of who’s a smoker; it’s not your age, your race, how much money you make, how educated you are; instead, it’s whether the people you know and the people they know are smokers.
You Can’t Analyze What You Can’t See
Now we come to the tricky bit. Relationships are super predictive, but you can’t analyze what you can’t see. Most data science techniques are built around tables. You feed in your Pandas DataFrame, and you have your Excel spreadsheet; however, it’s really hard to represent relationships in rows and columns. It’s also difficult to manually engineer the connected features that you think should be there.
So, let’s say I have an Excel spreadsheet, I have people, and I have their demographic data. I could manually engineer a column that says how many of their friends are smokers, but as I try to get further out in my graph, it’s nearly impossible. When you’re representing your data as a graph and representing those connections as first-class citizens, you don’t have to guess at the relationships; they are already there, inherent in your dataset.
Applying Graph Data Science
You can use graph data science to understand what’s going on in your data. This isn’t just Neo4j making up a new use for graphs. It has widely been acknowledged as an important foundational piece of modern data and analytics. Understanding the connections and the relationships between your data points and using that understanding to accelerate innovation is really the future of data science.
As AI maturity grows, we see more graph adoption by organizations. We see folks excited to use the predictive signal of connections to get better business outcomes. Academic researchers have figured this out too. The number of publications about graphs, data science graphs, AI, and analytics has increased from just over 200 publications ten years ago to over 6,500 publications this last year. That’s an incredible acceleration and shows academics understand that graphs faithfully represent data in a way that helps them make better predictions and find information that they just couldn’t access otherwise.
At Neo4j, we’ve seen a massive increase in the number of data science practitioners using our products. We have a Graph Algorithms book (that hopefully you’ve read) with over 200,000 downloads. Lots of folks want to use graphs, and we’re here to help you understand how to take your connected data and make sense of it all.
Innovating with graph really comes down to three things:
Step 1: Get your data into a graph.
Your first step is to get your data into a graph. In other words, represent your connected data in a connected shape and build that knowledge graph you’ll use to find the patterns you’re looking for in your connected data.
Step 2: Use graph algorithms to find what’s important.
Once you have your graph, you can start using graph algorithms, which are basically unsupervised machine learning techniques that help you find out what’s important in your graph, including which nodes are most important, which nodes are clustered together, which nodes are most similar, and which nodes are most unusual.
Step 3: Use machine learning to make predictions on your graph.
Then you can move from unsupervised machine learning to supervised machine learning, where you can turn your graph into a tabular representation that your machine learning models can understand and parse through.
From there, you can predict how your graph is going to change in the future. For example, using a supervised model, you can predict who is committing fraud, and you can train these supervised models and apply them to new data as it comes in. From your graph, you find patterns and anomalies, and finally you build predictive models to understand what to expect next from your data.
To recap…
The TLDR version of all this is that graphs and data science are all about getting better predictions out of your data. Traditional machine learning ignores network structure because you can’t really extract it. Graphs let you uncover patterns and trends that you just can’t find in any other way. If you don’t represent your data as a graph, you can’t find which node is most important.
Think about Google Workspace on PageRank, which is a graph algorithm that says the most important website for your search term based on how many other websites link to that website and how many websites link to those websites. Without a graph to represent that data, you really can’t access that information.
Graphs generate predicted features that you can incorporate into your existing machine learning pipelines. Graph algorithms and graph embeddings let you summarize the graph in a way that you can put it into your table, add some extra columns with your existing ML pipeline, and ultimately make better predictions. Neo4j is here to democratize the practice of doing graph data science. You shouldn’t need a PhD in network theory and 20 years of experience working with graphs to be able to gain insight from your connected data.
Neo4j Graph Data Science
Along with our database, we have Neo4j Graph Data Science, which offers you scalable graph algorithms, in-graph machine learning, and an analytics workspace to reshape your data. We also have Neo4j Bloom to help you visualize your data and collaborate with others. These give you the full package to understand your data: queries with the database, machine learning with GDS, and visualization with Bloom.
I work on Neo4j Graph Data Science, which has two parts that help you understand connected data: graph algorithms and machine learning models. These compute the metrics of your topology and connectivity, while helping you build connective models to enhance your graph. These algorithms and models are highly parallelized, meaning you can run them on tens of billions of nodes, no problem.
What makes the algorithms work is the analytics workspace, which is the tool that lets you take that underlying database and reshape it into your in-memory analytics graphs. You can choose the right slice of the data in your knowledge graph: people, places, or things.
Let’s say I only want to run algorithms on people. I can transform my graph into an in-memory graph optimized for graph algorithms. I can chain algorithms together, build predictive models, create workflows, and then, when I’m done, I can persist that information back to my database. When we talk about GDS, I also like to review two branches of machine learning, unsupervised and supervised, which the algorithms available in Neo4j Graph Data Science map to.
Two Types of Graph Algorithms: Unsupervised and Supervised
So when we talk about unsupervised machine learning, we’re talking about our graph algorithms. Neo4j offers 65-plus graph algorithms, more than any other vendor out there, which help you to answer: How is my graph connected? Where are the clusters? Which parts of my graph are more densely connected to each other? Which parts are likely to be connected? What patterns are common? It’s finding associations and lower dimensional representations with embeddings.
On the other hand, we have supervised machine learning, which allows link prediction and node classification. This is where we use the graph structure as labeled data to build a predictive model to understand how the graph is going to change in the future, or for data that is already in existence but has parts missing, you can fill it in. Neo4j is the only graph data platform that offers supervised machine learning.
Unsupervised Graph Algorithms

There are six categories of unsupervised machine learning algorithms:
- Pathfinding and search lets you take connected data and understand if there is a route between two points in the graph. Then you can ask: What is the shortest route? How many routes are there? Are there redundant routes? What is the best way to get from A to B? You see this used frequently in logistics and supply chain applications. We have a startup OrbitMI that is using these algorithms to route ocean-going ships at near real-time speed.
- Centrality and importance algorithms allow you to determine what network elements are most important. Each one of the algorithms in the image above describes importance in a different way. Degree centrality importance describes how many connections you have. PageRank is how many connections you have, plus how many connections your neighbors have, and how many connections their neighbors have, and so on. We see these algorithms used a lot in marketing or fraud detection.
- Community detection is for finding more densely connected parts of the graph. If you’ve ever done a k-means clustering on tabular data, community detection is the same thing, but on a graph. With community detection, we’re deciding which parts are more densely connected. It’s commonly used for looking for first party fraud. For example, the Louvain algorithm finds rings of connections and is commonly used to detect fraud rings. Label propagation is another example and is used to find who is influencing others and who is connected.
- Heuristic link prediction says that, given a pair of nodes, there should be a relationship or not based on some preexisting rules.
- Similarity algorithms, given a node, determine the most similar nodes in the graph based on the neighbors of that node, the relationships of that node, or the properties of that node. It’s commonly used in combination with graph embeddings.
- Graph embeddings learn the structure of your graph to come up with a numerical representation for each node. Let’s say you’ve got a five billion node graph. This means you have a five billion by five billion adjacency matrix. Graph embeddings boil all that information down into, say, 50 numbers per node, and those numbers can go into your machine learning model or be used with similarity algorithms to say, “Hey, this node here looks most like this other node here in my graph.” This is commonly used if you want to make recommendations for other nodes based on a node’s behavior. For example, similar nodes in the graph should buy similar products. You don’t have to hand engineer it. You can run the algorithms. It will identify what’s important, what’s unusual, what’s clustered together, and then you can review that and take action.
Supervised Graph Algorithms
With supervised machine learning, you can use graph features and graph models to make predictions. Supervised graph algorithms can make two different types of predictions.
- Predictions influenced by your graph structure: Like with a traditional machine learning model, you already have a pipeline to make a prediction. If you want to say who is going to churn, just take your graph, use algorithms or embeddings to create new columns in that data frame to make predictions, and because graph structure is influential, your accuracy improves.
- Predictions about your graph structure: You can also make predictions about the structure of your graph itself. You can think of this as enhancing your graph with missing data or with changes that are going to occur in the future. If I have a graph, I have nodes and relationships. Let’s say I want to predict who wants to buy what item next. That’s a relationship that’s going to form. Or say I want to predict who is going to commit fraud. That’s a node label. So you can predict how that graph structure will change in the future.
Neo4j’s In-Graph ML Models

What we offer in Neo4j is node classification (tells us what kind of node it is) and link prediction (tells us if there should be an edge between the nodes). The labeled data for these is just your graph itself. It’s the pairs of nodes that are linked or not linked or the labels that are applied to your nodes. If you want to know what features are important, you can choose a centrality algorithm or a community detection algorithm.
You can also use graph embeddings to represent the whole structure of your graph and use that as your input. In all these cases, Neo4j does the hard part: We do the test splits for you. We select the best performing model. We save it in the model catalog so you can apply that to new data and make new predictions.
The Only Completely In-Graph ML Workflow
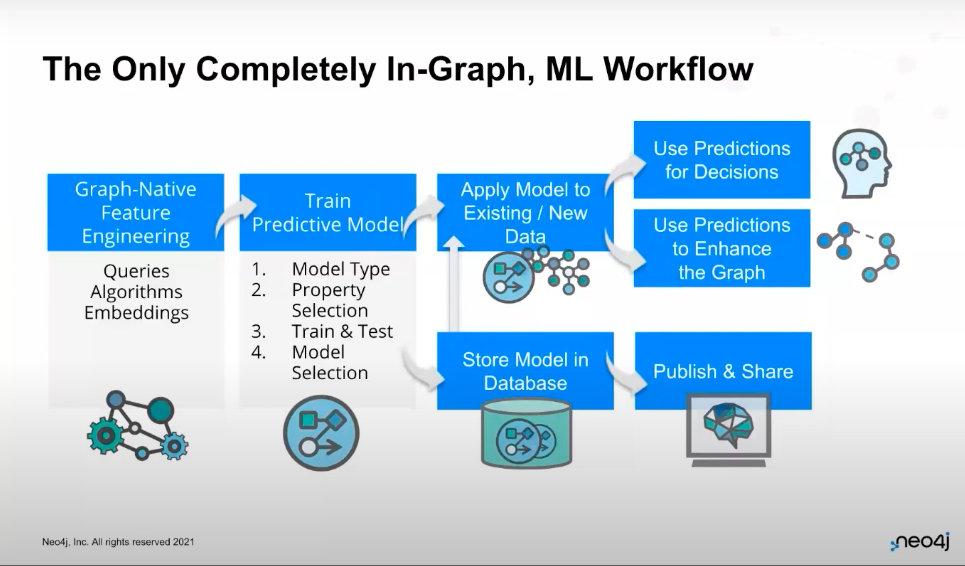
At the end of the day, Neo4j offers the only completely in-graph machine learning workflow. If you start with a graph in your database, you can use graph algorithms and graph embeddings to do feature engineering and describe your graph. Then, you can take the features and train your predictive models using our supervised ML pipelines.
Once you have those updated models, you can apply them to incoming and new data to make predictions, or you can apply them to existing data that you were missing labels for. You can then store your predictions in the database to be used again when you make decisions, want to enhance your graph, or want to understand your “unknown-unknowns”.
Graph Data Science Answers Your Big Questions
To sum it all up, graph data science is about answering your big questions. The connections in your data are really powerful, but it’s really hard to analyze them without a graph. Predictive signals get thrown out and lost in the noise. Graph data science lets you focus on the critical questions. What is most important? What is unusual? What is going to happen next? Ultimately, graph data science helps you make sense of your data.
Additional Resources
Hopefully you are excited and ready to get started! We’ve got codes if you want to look at demos. We’ve got books available for free such asGraph Algorithms and Graph Data Science For Dummies. If you want to get started with graph data science, the easiest thing you can do is go to Neo4j Sandbox. Automatically populate it with a dataset, run some algorithms, and get hands-on super fast.
Alternatively, you can use the Graph Data Science plugin on Neo4j Desktop or server. You just add it to your system and get up and running with calling those algorithms. Soon, you’ll also be able to access this on our cloud platform, Aura. So, wherever you are at in your graph journey, it’s just a matter of going to our website and downloading the plugin to get started.
Share Article


Explore
Related Articles

Why Healthcare CIOs Can’t Afford to Scale AI Without a Knowledge Graph Foundation

Finding the Fastest Way Out: How Dijkstra’s Algorithm Finds Shortest Paths