Exploring Ultimate Beneficial Ownership with Graph Technology

Solutions Engineer
6 min read
In this blog, I’d like to share insights from our recent webinar on Ultimate Beneficial Ownership (UBO) and how graph technology helps organizations tackle ownership transparency. During the session, we discussed the growing regulatory pressure around UBO identification and demonstrated how Neo4j enables organizations to understand complex ownership structures.
Understanding who ultimately owns or controls a company is central to modern compliance and risk management. A UBO is the individual who ultimately owns or exercises effective control over an organization, directly or indirectly.
In practice, ownership structures are rarely simple. Companies are often embedded in multi-layered hierarchies spanning jurisdictions, holding entities and indirect control paths. Tracing these relationships using traditional approaches quickly becomes complex and difficult. In large financial institutions, answering a seemingly simple question like ‘Who ultimately owns this entity?’ can take days of manual investigation across disconnected systems.
Regulatory frameworks such as the EU’s 6th Anti-Money Laundering Directive (6AMLD) reinforce the need for clear, transparent, and explainable ownership. Meeting these requirements demands technology that can naturally model and analyze complex, interconnected structures. Graph databases are uniquely suited to this challenge and provide a powerful foundation for UBO analysis.
Why Graphs are a Natural Fit
Ownership and control are fundamentally about relationships. People own companies, companies own other companies, and influence flows through chains of ownership connections. In graphs, these relationships are modeled explicitly. Structures that are difficult to trace in spreadsheets or relational tables become intuitive when represented as a graph.
With a graph database, you gain:
- A consistent source of truth across ownership and control data
- Real-time answers to complex, multi-level questions
- Greater accuracy and reduced compliance risk through relationship-based logic
- Lower operational costs by minimizing manual investigation
- Clear transparency through visual and interactive exploration
These advantages make graph databases a powerful platform for UBO analysis and explainable insights.
A real-world example of this approach comes from our customer story with Dun & Bradstreet Using Neo4j, they model corporate hierarchies as connected graphs, enabling customers to explore ownership and control across regions and multiple levels of indirect influence.
Demo: Navigating UK Company Ownership with Companies House Data
To demonstrate what graph technology can achieve for UBO analysis, I built a demo using two datasets from UK Companies House:
Using these datasets, I transformed and modeled the data as a graph and ingested millions of records into Neo4j using the Spark Connector for Neo4j
The resulting graph contains:
- Over 16 million nodes
- Over 18 million relationships
The model includes companies, individuals, legal entities, addresses, industry codes, and ownership relationships. Even though this demo already operates at a multi-million scale, the same modeling approach extends to graphs containing billions of nodes and relationships. Neo4j is designed to efficiently traverse deeply connected structures, meaning that multi-level ownership analysis remains performant even as datasets grow to enterprise scale.
Visualizing the Ownership Graph
To understand how the data fits together, we can run:
CALL db.schema.visualization()
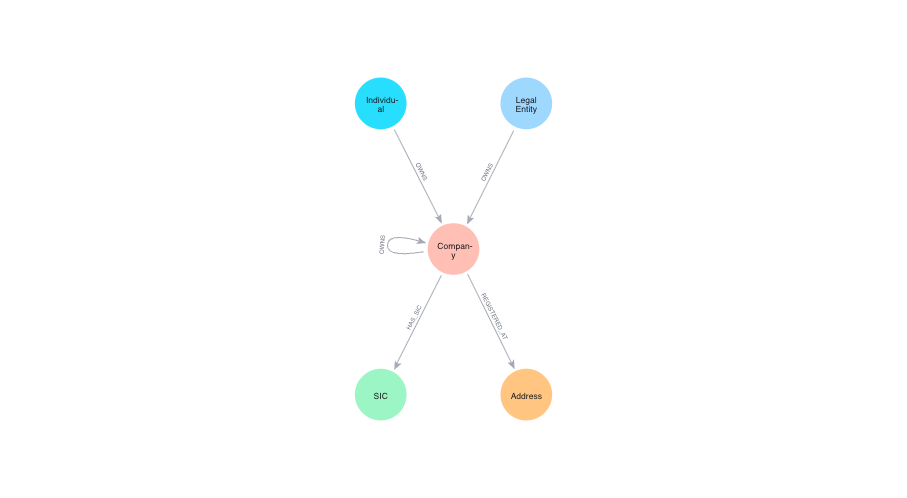
This schema visualization shows how the entities are connected and forms the foundation for all subsequent queries.
Example Queries You Can Run
With the graph in place, you can run powerful ownership queries such as:
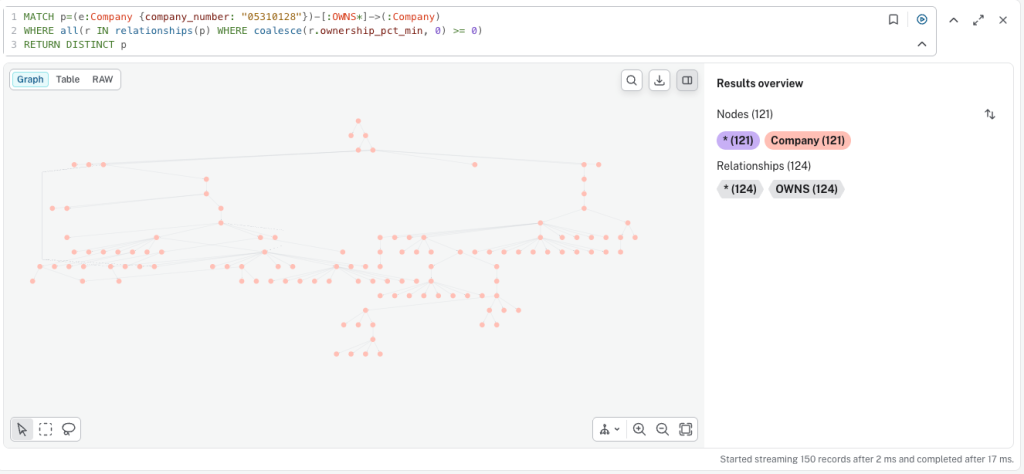
Explore Ownership Networks Visually
We can find a company and explore all its subsidiaries. Below, we start with TELEFONICA O2 HOLDINGS LIMITED. The query can easily be extended to filter by ownership percentages and calculate total ownership across indirect paths.
MATCH p=(e:Company {company_number: "05310128"})-[:OWNS*]->(:Company)
 WHERE all(r IN relationships(p) WHERE coalesce(r.ownership_pct_min, 0) >= 0)
 RETURN DISTINCT p
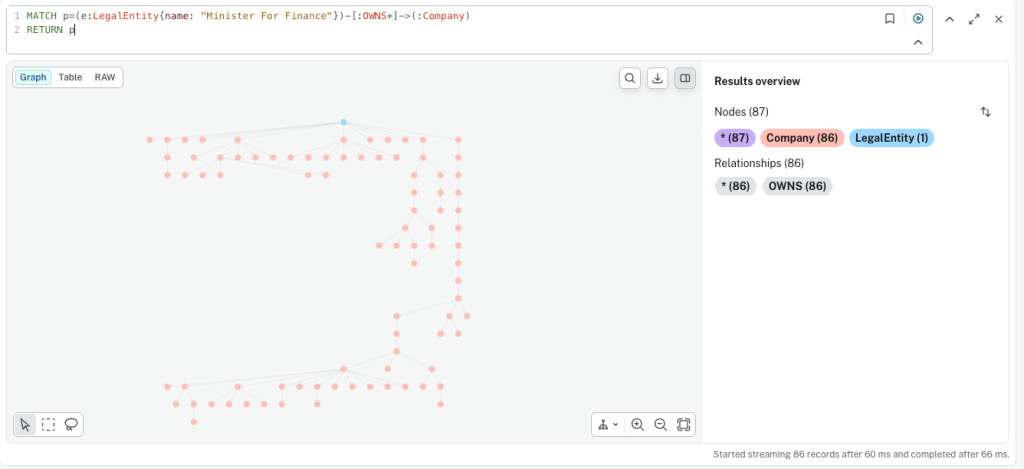
Legal Entities with Significant Control
In this dataset, legal entities (often government organizations or institutions) can also appear as UBOs. The following query identifies all companies that ultimately, directly or indirectly, list the Minister For Finance as their UBO:
MATCH p=(e:LegalEntity{name: "Minister For Finance"})-[:OWNS*]->(:Company)

RETURN p
RETURN p
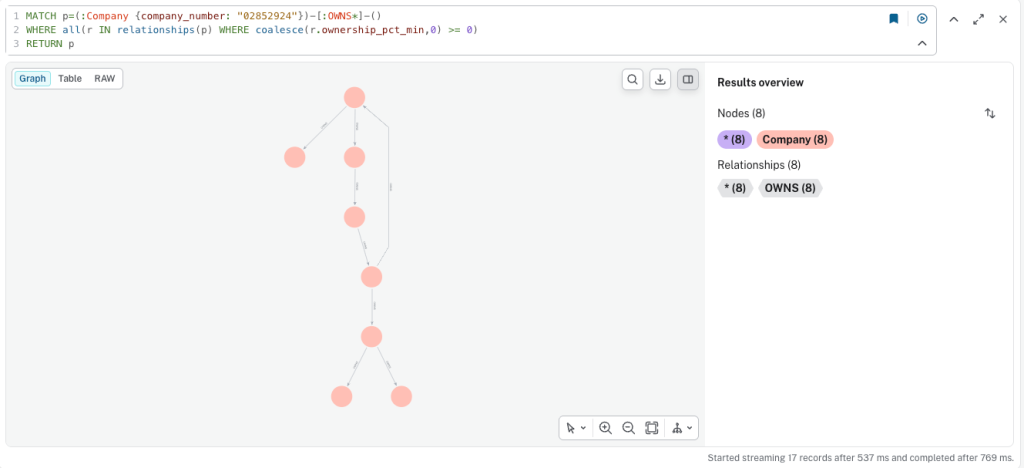
Identifying Circular Patterns
Cypher allows us to traverse ownership relationships flexibly and detect patterns that would be difficult to identify otherwise. Below is an example of a company structure containing a circular ownership pattern:
MATCH p=(:Company {company_number: "02852924"})-[:OWNS*]-()
 WHERE all(r IN relationships(p) WHERE coalesce(r.ownership_pct_min,0) >= 0)
 RETURN p
Making Ownership Data Accessible Across the Organization
Cypher is powerful, but not every user wants to write queries. Different roles interact with data in different ways, and a single interface doesn’t fit everyone. That’s why Neo4j provides multiple tools tailored to specific use cases. Let me introduce a few of them.
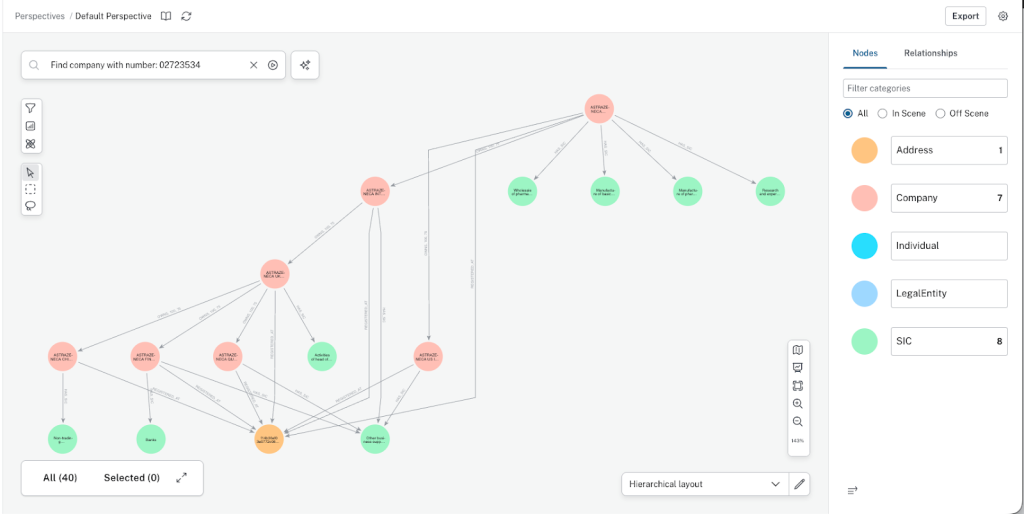
Neo4j Bloom
Neo4j Bloom provides a visual exploration layer on top of the graph. Analysts can search, expand paths, and trace ownership structures without writing Cypher.
Bloom makes it easy to:
- Follow indirect ownership and control paths
- Spot unusual or complex structures visually
- Explain relationships during reviews or investigations
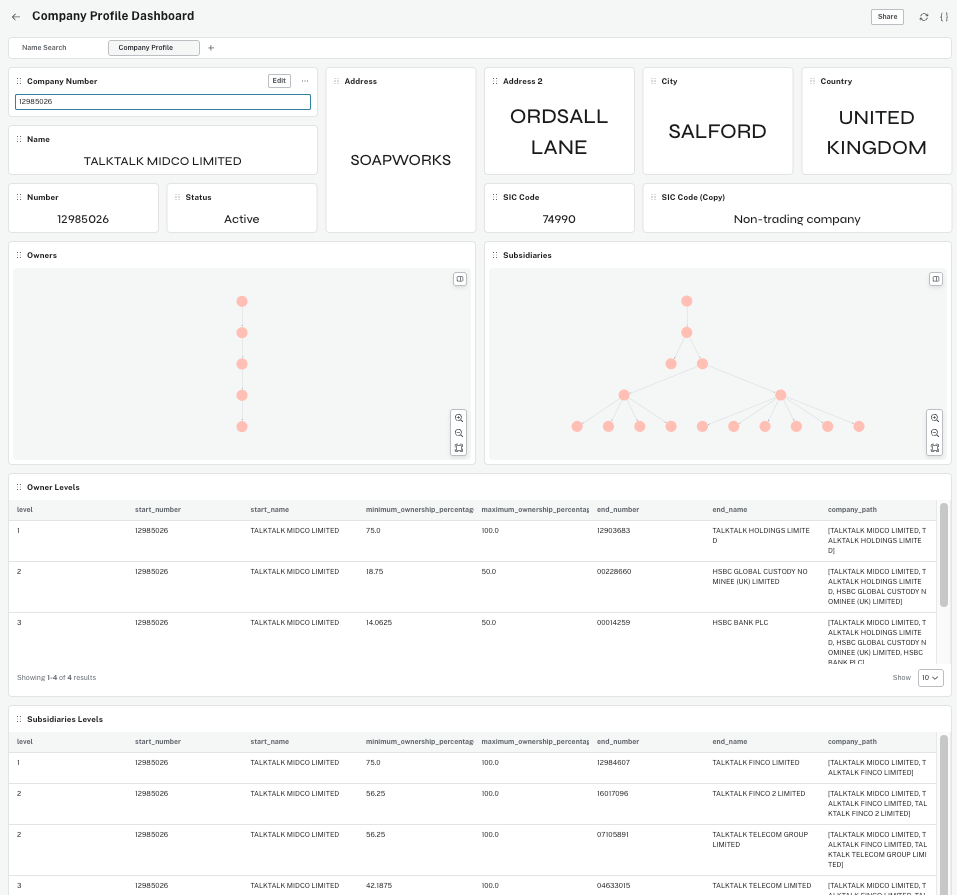
Dashboards
Business users and decision-makers benefit from dashboards that aggregate graph insights into operational views.
Dashboards can highlight:
- Companies without identified UBOs
- Individuals with influence across many entities
- Ownership depth and structural complexity
This enables organizations to monitor risk, track trends, and support compliance efforts at scale.
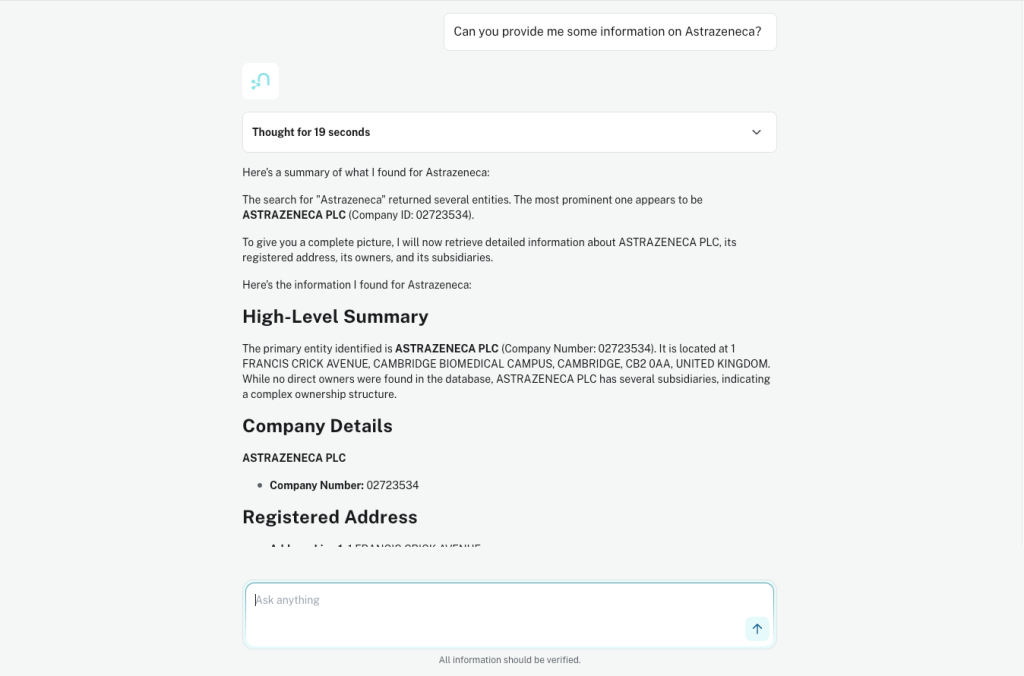
Natural Language Interaction with Neo4j Aura Agents
Beyond visual exploration and dashboards, graphs also enable agentic AI.Neo4j Aura Agents provide a new way to interact with the graph using natural language. Aura Agents allow you to build, test, and deploy AI agents grounded in your AuraDB knowledge graph.
The agent transparently reasons over the graph using specialized tools to deliver accurate and explainable answers. This enables users to interact with the data without the need to understand Cypher or the underlying schema.
Conclusion and Next Steps
Graph technology transforms the inherently connected world of ownership and control into a structure that is easy to query, explore, visualize, and reason over. From detailed Cypher investigations to visual exploration in Bloom, operational dashboards, and natural language interaction via Aura Agents, organizations can bring transparency and scalability to UBO analysis.
To explore the demo yourself:
- Code: All materials (including the data model, ingestion scripts, and example queries) are available in the Github repository
- Recording: You can watch the full demo walkthrough in the webinar recording: Watch the Webinar Recording
If you have questions or would like to try this approach yourself, feel free to reach out. I’d be happy to discuss it further.
Share Article


Explore
Related Articles
Capgemini Turns Data and AI Into Connected Intelligence With Neo4j and Databricks

Neo4j Community Edition Advances for Graph-Powered AI and Intelligent Applications
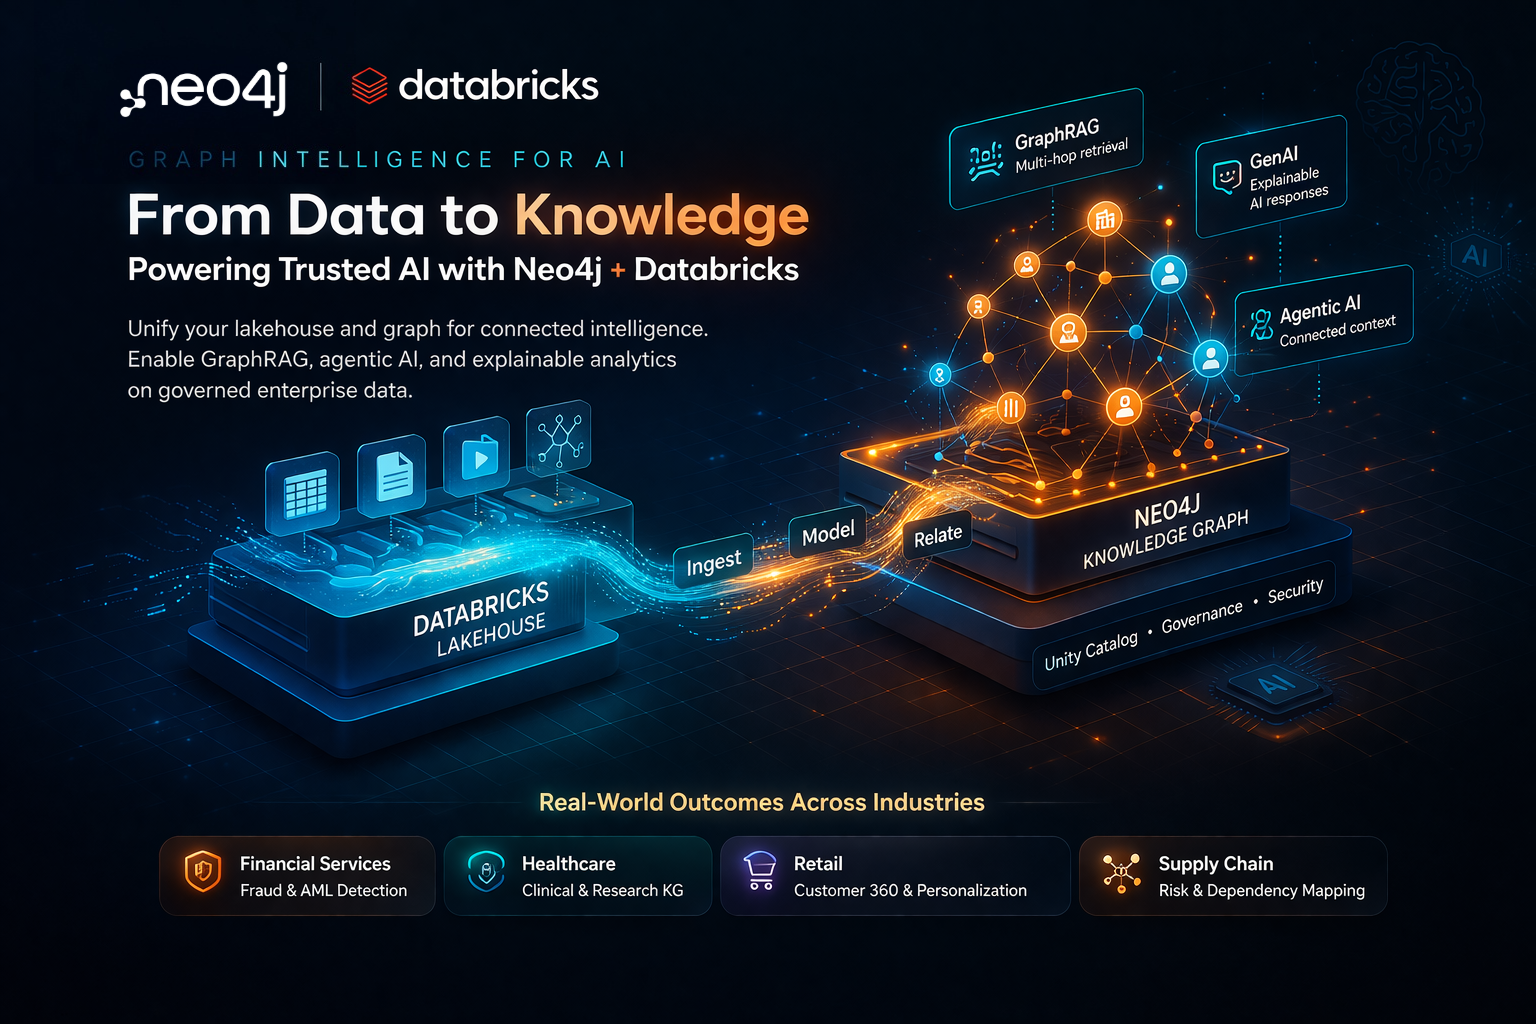
Power Connected Intelligence for AI and Analytics with Neo4j and Databricks

Neo4j Brings High Speed Identity Resolution to the Snowflake AI Data Cloud
The Data Strategy That Makes Truly Personalized Customer Experiences Possible