Graph databases for beginners: Wait, what do you mean by “graph”?

Blog Editor, Neo4j
8 min read

When I was in college mathematics class, I was given a Traveling Salesman Problem for the first time.
It’s a classic problem that asks: Given a list of destinations and the distances between each one, what is the shortest possible path a salesman could take to visit each city and then return home? You can see an example in the image below.
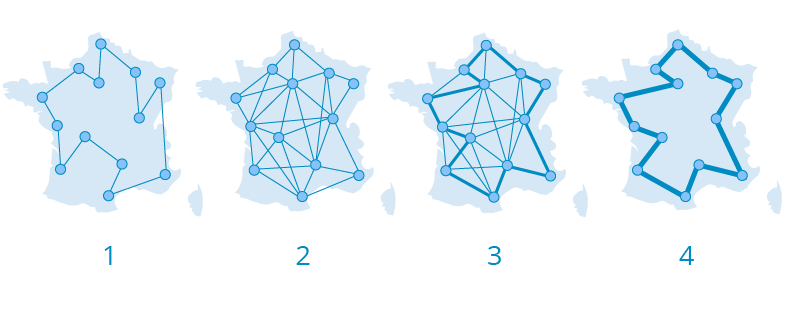
An example of the traveling salesman problem navigating the shortest path between various cities in France.
I was never a math person; seeing a mere quadratic equation instills in me the wish to dig a hole, get in and never come back out. But this problem was different: When I was told to find the shortest route for the traveling salesman to go through every city and end up in the same spot, I beat all of the other math nerds in my class.
That was the first time I had seen an actual graph – and I realized that math could be interesting too.
In this Graph Databases for Beginners blog series, I’ll take you through the basics of graph technology, assuming you have little (or no) background in the space.
This week, we’ll start by defining what a graph actually is – and what it’s not – before discussing just a few ways literally anyone can use this mental model.
First things first: Graph vs. chart
The word graph doesn’t mean what you think.

If you didn’t study mathematics or computer science in university, it’s not your fault you’re defining graph wrong. Mainstream culture uses the word in an entirely different way, so let’s deconstruct that definition a bit.
When someone says the word graph, the first thing that may come to mind is algebra class back when they had to plot variables along a line using x and y coordinates. Something like this:

Not a graph. Source.
But… that’s not actually a graph*. Not in the computer science or technology sense we’re working within.
For a lot of people, the word graph might conjure up something that looks like this:

Not a graph.
But the image above isn’t a graph either. Although it’s commonly called a line graph, it’s not the same kind of graph we’re talking about today. A line graph is actually just another kind of chart, just like this one:
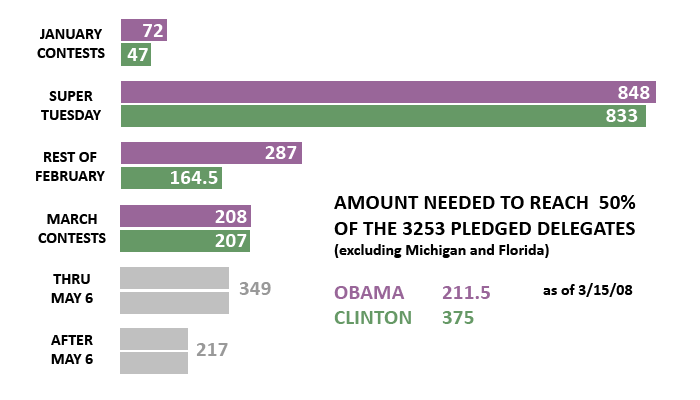
A bar chart. Not a graph
Or this one:
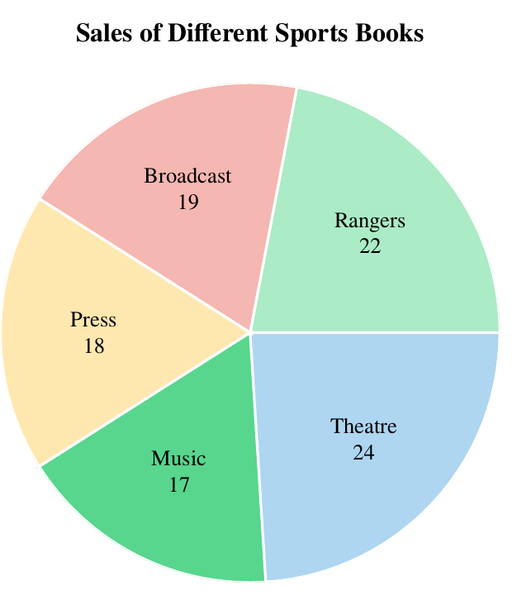
A pie chart. Not a graph. Source.
Or this one:
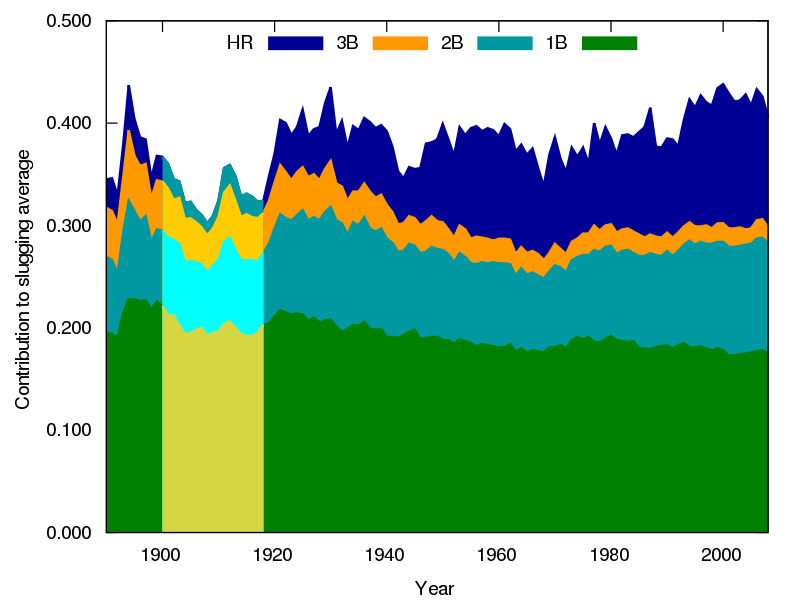
An area chart. Also not a graph.
Or even this one:
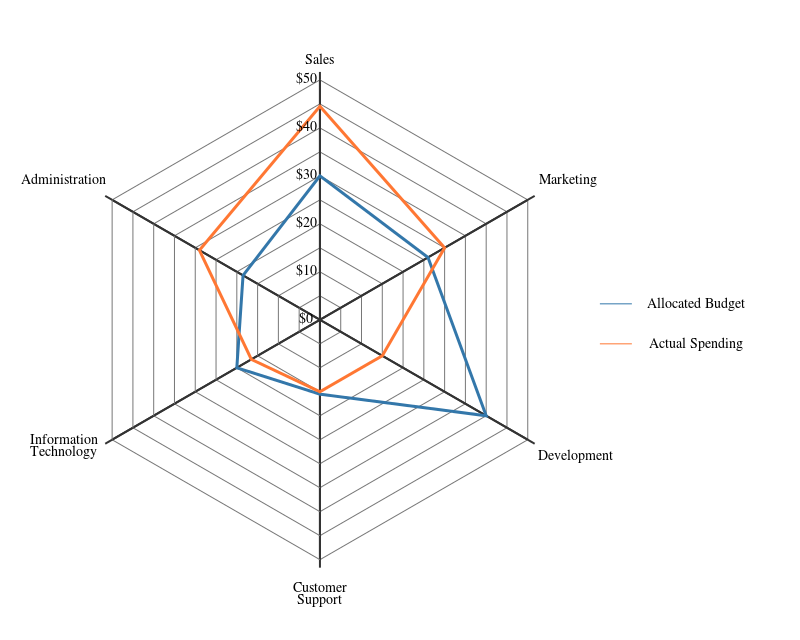
A radar chart. Still definitely not a graph.
None of these images above is a graph; they are all some kind of data chart. A chart is a graphical representation of data – often statistical in nature – which includes line graphs, bar charts, pie charts, radar charts and heat maps.
So what does a graph look like? A real graph looks like this:

Wow, finally, a real graph.
What actually *is* a graph?
A graph in this context is simply a network of entities and how they relate to each other. A graph is made up of two basic units: nodes and relationships.
Wait, What’s a Node?
Nodes represent entities, i.e., people, places, things, systems, stuff or any other noun. The simplest possible graph is a single node. Like this one:
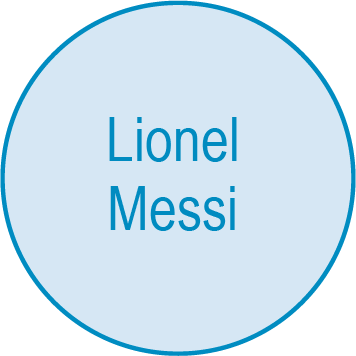
A lonely node.
This graph consists of a single node: Lionel Messi. Right now, this graph doesn’t have any relationships or any other nodes. But it can be connected into more complex, richly interconnected structures.
And What’s a Relationship?
In a graph, a relationship (sometimes called an edge) connects any two nodes.
Relationships connect and organize nodes into structures, giving context to all of the nodes they bridge between. Relationships allow a graph to resemble a list, a tree, a map, a compound entity, a double-helix DNA strand, a money-laundering ring, a corporate org structure… wait, I’m getting ahead of myself.
Our example Lionel Messi graph makes a lot more sense once we add more nodes and relationships to it:
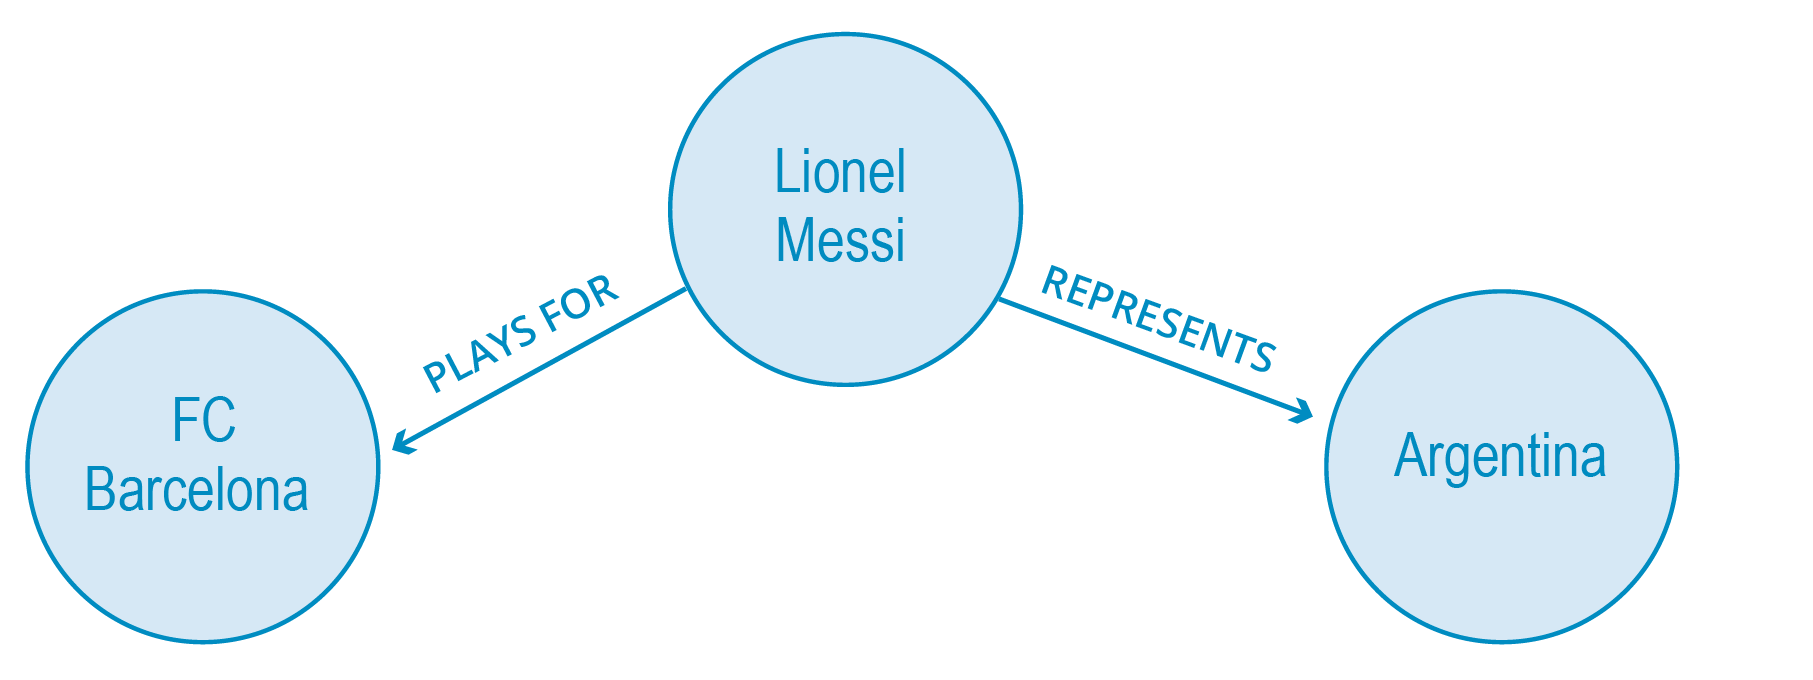
Nodes and relationships in a graph create context.
As you can see, just a few nodes – and relationships to link them – create a highly contextual model that’s simple to understand.
The basics of graph theory
What is graph theory? It’s the mathematical study of graphs (i.e., networks of nodes and relationships).
This whole branch of mathematics related to nodes and connections was discovered when Leonhard Euler, a Swiss mathematician, solved the Königsberg bridge problem in 1735.
A lot has already been written about this classic graph problem, so I’ll be brief: In the city of Königsberg (pictured below), citizens posed to each other the challenge of finding a path through the city that crossed each of the seven bridges once and only once. Through the power of math, Euler proved that no such path exists – and as a result, discovered the first theorem of graph theory.

The seven bridges of Könisberg. It was a common challenge to find a path that crossed each bridge once (and only once). Euler used graph theory to prove it impossible to find such a path. Source.
Today, the application of graph theory is used in more areas than one might think.
Computer scientists use graphs to model and develop algorithms and programs. Chemists use graphs to model chemical structures. Practitioners in the social sciences use graphs to study social interactions and relationships between people via social network analysis. In fact, graph theory is even used for recreational purposes: a lot of puzzle games are simply graph problems, and a lot of game producers profit from creating Eulerian or Hamiltonian graph puzzles.
Of course, one of the most powerful applications of graphs is for database management.
Putting Graph in Graph Database
When most people use the word “database,” the first thing we usually think of is a set of tables like in the image below.

A relational database model.
The reason we picture tables is because since the 1970s, the database world has revolved around the relational data model. (Watch out: “Relational” is an algebra term that has nothing to do with relationships! Let’s just admit: Some mathematicians just weren’t good at naming things.) But database doesn’t have to equal tables.
Now, forget about the traditional relational database model.
Thanks to a bunch of Swedish math nerds, databases now tap into the graph data model instead of just the default relational model. Graphs allow backend developers and architects to model their data in a way that’s more flexible and efficient for connections-oriented queries. Thus, the graph database.
Modeling data as a graph is easy: Draw a node to represent a person, an object, a place, a category or any other piece of data, and connect those data points with lines that show how one entity relates to another. Boom, now you have a data model.
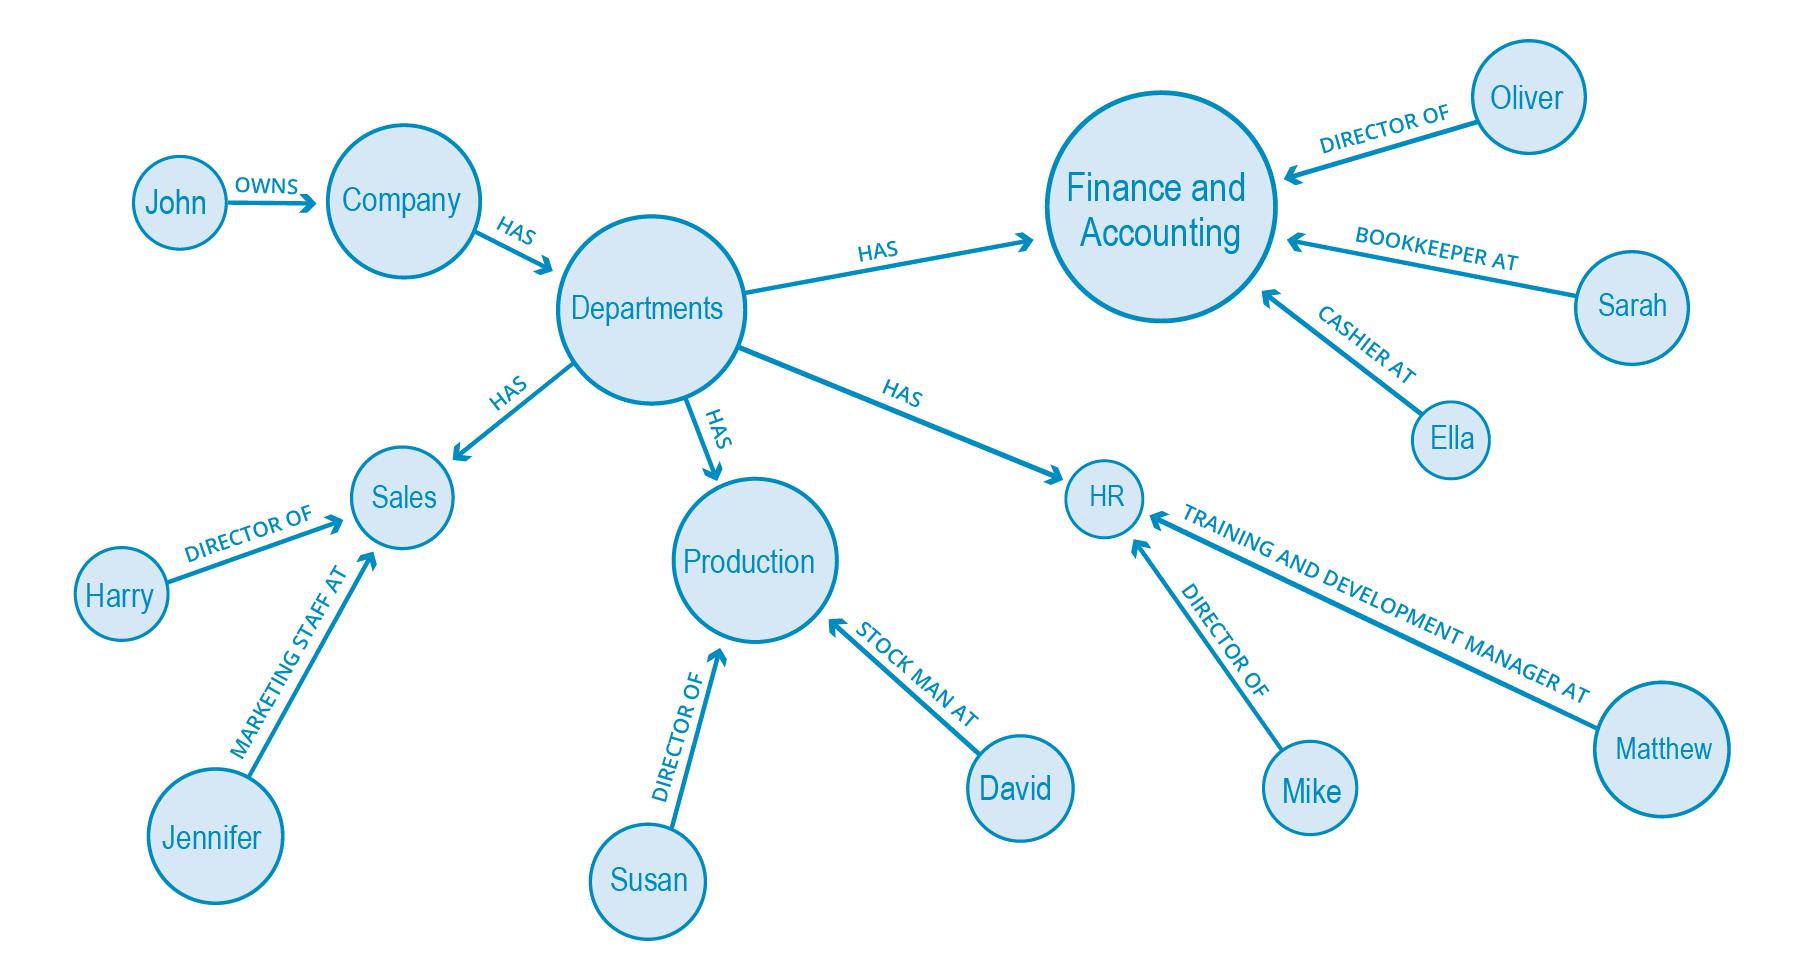
A graph data model using nodes and relationships.
In the end, you get a diagram so simple even a child can understand it.
The early tech giants like Google, Facebook, LinkedIn and PayPal all tapped into the power of the graph data model to build their business empires. Their secret? They each used graph database technology to harness the power of connected data.
Of course, this is only a brief summary of graph databases. Defining and diving into the whole new world of graph database technology requires its own blog post (or maybe even a series).
Conclusion
Over the last three centuries, graph theory has been adopted as a tool to study or model a wide range of other subjects. It’s one of those distinct fields of mathematics where you don’t need to be good at solving numbers or equations to excel.
However, graph theory wasn’t picked up as a database model until the 21st century (literally, in the year 2000). In a constantly evolving world that places a premium on innovation, connection and simplicity, graph technology – with its agility, flexibility and performance – is the future.
So at the end of the day, what do we mean when we use the term “graph”? We mean everything is connected.
Catch up with the rest of the Graph Databases for Beginners series:
- Why Graph Technology Is the Future
- Why Connected Data Matters
- The Basics of Data Modeling
- Data Modeling Pitfalls to Avoid
- Why a Database Query Language Matters
- Imperative vs. Declarative Query Languages: What’s the Difference?
- Graph Theory & Predictive Modeling
- Graph Search Algorithm Basics
- Why We Need NoSQL Databases
- ACID vs. BASE Explained
- A Tour of Aggregate Stores
- Other Graph Data Technologies
- Native vs. Non-Native Graph Technology
*Whoa there, smarty pants: Yes, technically, it is the graph of a function, which, if you already knew that, then this blog post is written way below your level. You should probably skip ahead to our developer docs.
How graph databases are reshaping science and society
Learn how graph databases help us explore space, cure rare diseases, increase crop yields, and much more.
Share Article


Explore
Related Articles

A workbench for teams to query, explore, and visualize graph data
SumoDB in Neo4j: Chaining Multiple Graph Algorithms in Snowflake — Part 3


Why machines need embeddings: Turning graph structure into features