Graph embeddings: AI that learns from your data to solve problems

Senior Director of Product Management, Graph Data Science
13 min read
In today’s economic climate, we need deep, reliable insights and strong predictions. Data is our most valuable asset, but the relationships in and across data remain largely untapped.
Graph embeddings are a new technology that learns the structure of your connected data, revealing new ways to solve your most pressing problems – and adding visibility to your blind spots.
As more and more organizations have realized the value of the connections within their data, graph analytics is widely acknowledged as foundational to a modern data and analytics strategy. Gartner for example predicts that graphs will be used in 80% of data and analytics innovations by 2025, up from 10% in 2021.
Powerful deep queries on knowledge graphs rapidly answer business questions that would have taken weeks to research in the past. Graph visualization tools facilitate open-ended exploration and spur aha moments.
But what about analyzing – or making predictions with – a whole graph? Or moving beyond the questions that you already know how to ask?
A common first step is using unsupervised machine learning (ML) techniques – graph algorithms – to identify patterns, anomalies, and more. For example, data scientists can use centrality algorithms such as PageRank to identify the most important person in a company, or a community detection algorithm like Louvain to identify money laundering.
The next frontier in analyzing graphs is applying supervised ML: predicting what’s going to happen next, filling in missing data, and understanding how your graph structure can forecast the future. That’s where graph embeddings come in, and why they are a foundational technique to unlock the insights within your connected data.
In this blog post, we will explore:
- Why we need graph embeddings now
- What graph embeddings are – and how they work
- Real-world uses for graph embeddings
- How to get started
- Key takeaways
Why we need graph embeddings now
Graph embeddings are the technology used to translate your connected data – knowledge graphs, customer journeys, and transaction networks – into a predictive signal.
Data scientists typically rely on historical data to fuel predictive models. But given recent black swan events like a global pandemic and natural disasters, such data is much less predictive. Instead of looking to the rows and columns of our tabular past, graph embeddings let you extract the insight in your connected data.
Graphs can represent almost any kind of data, from complex supply chains, medical research, customer 360, and fraud detection.
What’s predictive in all that data in your graph? Data scientists often start by exploring their graph and running various graph algorithms to try to pick out patterns and anomalies – but that’s a pretty limited approach. Each particular graph algorithm always and only looks for the specific patterns it is designed to uncover. PageRank is always PageRank, and the only thing it can tell you is how important a node is.
Graph embeddings are different: they look at the unique data in your graph and learn from it to solve your problems. Instead of guessing which algorithm is going to tell you something useful, graph embeddings highlight predictive patterns you would not think to look for. In this sense, graph embeddings are a bit like a cheat code for learning about your graph.
Graph embeddings show you what’s predictive without any guesswork, saving hours of trial-and-error manual feature engineering. A senior data scientist at a major insurance firm expressed his team’s excitement about graph embeddings: “It takes us forever to do feature engineering, where we try this algorithm and that algorithm, and then the feature we select turns out not to be predictive.”

Everything is naturally connected.
Embeddings are math not magic
The idea that your graph can tell you about itself sounds like magic. As Clarke’s third law states, “Any sufficiently advanced technology is indistinguishable from magic.” Despite their appearance, graph embeddings are cutting-edge math, not wizardry.
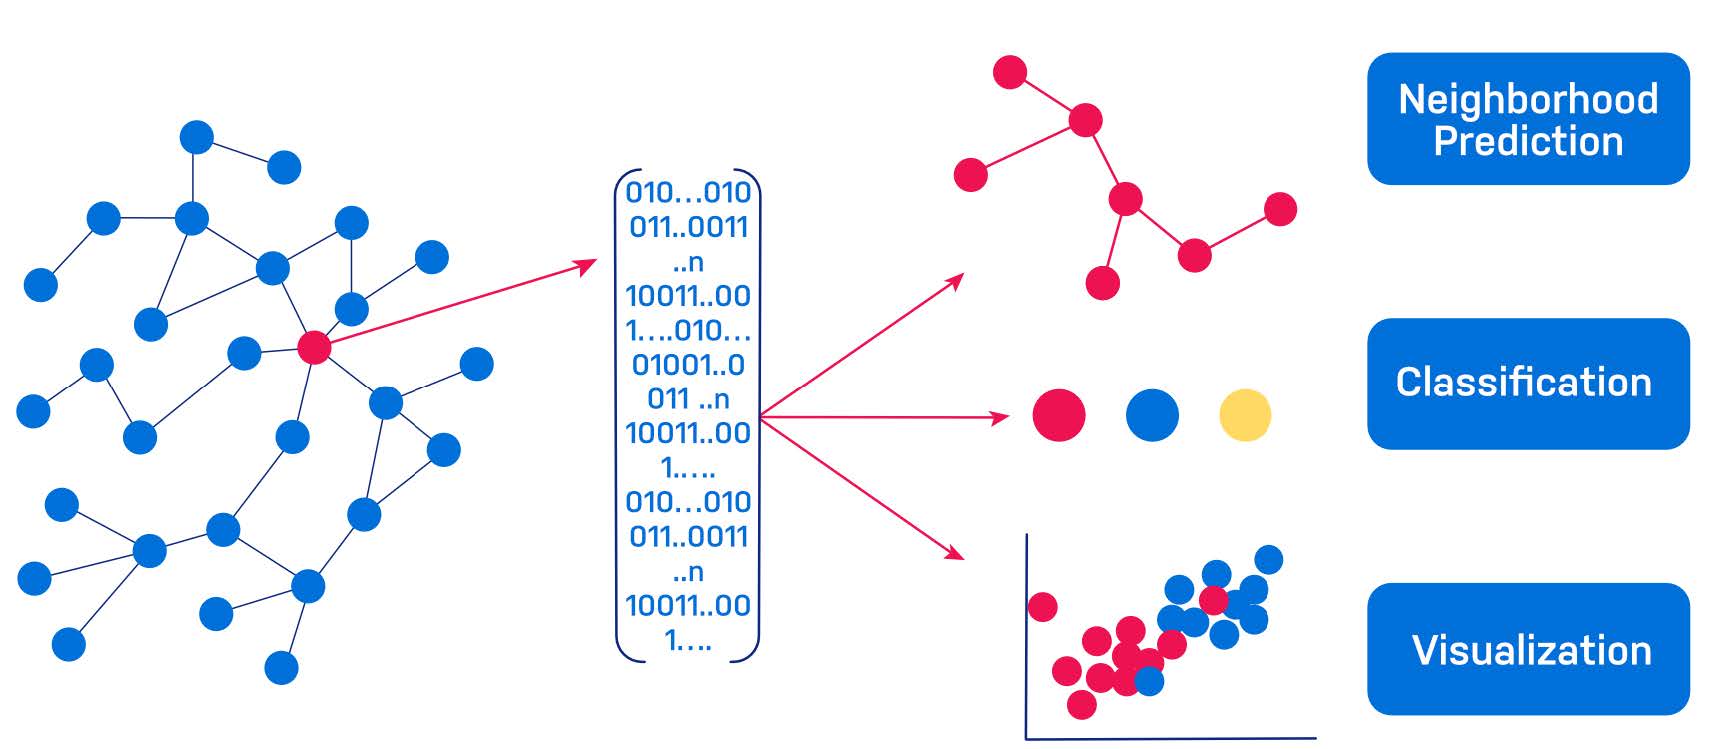
A graph embedding transforms your graph into numbers. Graph embeddings take all the information in your graph and learn from it, deriving numerical representations that can illuminate patterns and surface connections that you may not know are there. Because graph embeddings are accurate mathematical representations of your data, the signals they surface are reliable to move your business forward.
A graph embedding reflects all your graph’s important features. Just like a portrait encodes a three-dimensional person into two dimensions, an embedding condenses your graph so it’s simpler but still recognizable.
In a graph, the structure of the data – connections between data points – is as important as nodes and their properties. The nodes are data. The relationships that connect the nodes are data. And the properties assigned to these nodes and relationships are also data. Simple techniques like counting up the number of neighbors for each node miss the structural context and richness encoded in your graph. Embeddings can take all that information and translate it into a single, meaningful vector that encodes nodes, their properties, their relationships to neighbors – and their context in the entire graph.
Embeddings can describe different aspects of your graph: nodes (things), relationships (connections), or even the whole graph! Embeddings enable you to create a mathematical representation from your data that’s uniquely tuned for answering your questions.
Graph embeddings create numerical representations of your specific graph data.
The math behind embeddings
Generating embeddings and using embeddings are interrelated: The technique you choose will be informed by the data you have and the problem you’re trying to solve.
To calculate embeddings, first you identify the nodes, properties, and relationships you want to embed – essentially, what you want to consider when translating your graph into numbers.
After selecting your data, you choose your embedding technique. Neo4j Graph Data Science currently supports the embedding techniques in the table below.
After selecting your embedding, there are various configuration parameters you can use to customize and tune your embedding – to make sure it provides an accurate representation. You can control what your embedding learns, how long it should run for, how it measures accuracy (the correctness of the results), and even how various features are encoded.
After you generate your embedding, you can use embeddings in several ways:
Calculating similarity. Embeddings encode graph similarity – whether it’s structural equivalence, similar properties, metrics like cosine similarity to find similar nodes, or building a nearest neighbor graph. On a retail graph, products with similar embeddings are often good recommendations because the embeddings capture customer behavior.
Visualizing your graph as a chart in two- or three- dimensions, with techniques like PCA and t-SNE plots. Visualizations let you identify clusters or patterns; AstraZeneca used patient journey embeddings to visualize and distinguish patients with different diagnoses (Figure 3).
As a feature to train a supervised machine learning model to perform tasks like node classification and link prediction. For example, on a graph of banking transactions, you can calculate a node embedding for each account holder, and use those embeddings to predict which accounts are likely to be committing fraud based on their behavior.

Exploring patient journeys as a three-dimensional t-SNE plot.
Real-world uses for graph embeddings
Graph embeddings aren’t just theory, but how cutting-edge businesses do AI better. Now let’s talk about some of the ways that today’s organizations are using the advanced math of graph embeddings to their advantage.
Finding fraud
Fraud is often identified by spotting anomalous transactional behavior. Embeddings can distinguish normal transactional from fraudulent behavior by encoding the behavior of normal and abnormal accounts, and training a predictive model to distinguish them. The embedding distills all of this rich information in the graph – about who someone is transacting with, how frequently, and how dense those connections are – incorporating the larger network that indicates a pattern that deviates from normal transactional behavior.
Entity resolution & disambiguation
A common problem users face – from marketing to retail to banking – is identifying and de-duplicating unique users (or items, documents, and so on) in a sea of data. Graph embeddings simplify this problem drastically. By encoding each node and its context in the greater graph – its properties, neighbors, their neighbors, and so on – you can use basic math to identify nearly identical embeddings. They highlight similarities between nodes, enabling you to determine where what appears to be multiple people is really just one person.
Improving product recommendations
In the past, collaborative filtering was a common approach to improving recommendations: people who bought this item also bought these other items. Embeddings take recommendations a step further.
An embedding can encode not only what someone bought – but how many other things that person bought, who else bought those things, what else those people bought, and so on across the whole graph. In a very large product catalog, graph embeddings support strong recommendations because they mathematically highlight closely related items, even if those items are rarely viewed.
Discovering new drugs
Knowledge graphs are fundamental to many pharmaceutical R&D teams. Systems biology is naturally graphy – the connections between genes, chemicals, and diseases encode the causes and cures for myriad conditions. Graph embeddings can encode this information: how each gene is connected, how far away, and via what intermediate nodes to a disease, or what chemicals might modify genes by direct interaction or interference with upstream pathways. These rich and descriptive embeddings can be used as input for link prediction models. These models use existing knowledge to uncover previously unknown associations between genes and diseases, or drugs and genes – identifying promising new treatments.
Predicting churn
Many companies – from retail stores to SaaS platforms to traditional utility providers – care deeply about churn. An example is telco churn, where a user chooses to leave a cell phone provider. These customer decisions take place in the context of all their interactions with the provider: previous purchases, store visits, or customer service calls. The context can even include interactions with other customers (phone calls, texts) as well as those other customers’ experiences. By encoding that rich detail as a knowledge graph, we can train embeddings to represent each customer’s experience, and then use those embeddings to predict who is likely to leave a service, so early intervention can save their business.
Neo4j graph data science
Graph embeddings are a powerful way to learn the predictive elements from your data quickly and reliably so you can make decisions informed by all the hidden connections in your data. A key challenge for enterprise teams, though, is putting state-of-the-science techniques into production – quickly, reliably, and at scale.
That’s where Neo4j can help. Our customers tell us that although they knew about graph embeddings, they really couldn’t use them until they got started with Neo4j Graph Data Science.
Neo4j is the leader in graph analytics and graph-based ML, empowering more data science with less pain. Our data science platform combines:
- Neo4j Graph Database, for storing, persisting, and querying connected data
- Neo4j Bloom, for visually exploring connected data
- Neo4j Graph Data Science, or GDS, to execute graph machine learning at scale
Neo4j offers more graph data science techniques than any other vendor, with over 60 ready-to-run algorithms and ML models, and new ones added all the time. Neo4j offers users the ability to transform their data, generate predictive features, and train and select the best- performing model – all with a few commands, without ever having to leave the GDS environment.
Our customers tell us that using GDS enabled them to move past just reading academic papers about embeddings and actually put them to work. Neo4j Graph Data Science includes powerful features that greatly reduce the work of creating predictive models and address some of the gotchas – like data leakage – increasing data scientist happiness and productivity. Our implementations are highly parallelized to scale over tens of billions of nodes, so you get meaningful results that you can use – quickly. We support MLOps, with a model catalog where you can store your trained models in Neo4j.
Neo4j Graph Data Science runs on the most widely deployed graph database. The Neo4j Graph Database offers enterprise features such as data versioning as well as read replicas for scaling and disaster recovery.
Wherever your data lives, Neo4j makes it easy to get started, with supported connectors for Spark, Kafka, and BI tools like Tableau as well as drivers for Python, Java, Go, and more.
Neo4j Bloom is a beautiful and expressive data visualization tool that empowers business stakeholders and data scientists to freely explore their data and all its connections, accelerating collaboration and insights. For embeddings, this means viewing your results – predictions and newly identified similarities – in the context of all the data that went into the calculations.
Neo4j offers flexible, cloud-independent deployment; download and deploy Neo4j yourself on your favorite cloud platform, on-premises, or get started on-demand with Neo4j AuraDS, Neo4j’s fully managed cloud offering.
Key takeaways
Here are some key takeaways that showcase what graph embeddings offer:
Gain a competitive advantage. You can’t afford to ignore graph embeddings. They surface new information that leads to fresh insights and ideas.
Make better predictions. Graph embeddings do the heavy lifting of feature engineering, identifying predictive elements to include in ML models.
Get data scientists up to speed fast. It’s hard to find data scientists who are experts in your domain. Because graph embeddings learn from your data itself, they enable data scientists who may not be specialists to effectively work with your data and be fully productive fast.
Extract the full value from your data. Your data may be unevenly distributed or sparse in some areas. Graph embeddings help you get the most from your data, whatever its state. Using graph embeddings, your recommendations are relevant even for infrequently purchased items.
Know more. Embeddings learn from your knowledge graph; incorporate those learnings to further enrich your knowledge graph.
Iterate and innovate. Use multiple graph embedding techniques to learn different things from your data. Iterate using graph algorithms, queries, and visualizations to drive targeted innovation and fresh discoveries.
Ready to get started?
Download Neo4j, try out a sample project in our sandbox, or get started with Neo4j AuraDS, our fully managed cloud offering.
Want to learn more about graph data science? Learn about what customers like Meredith Corporation, AstraZeneca, and NASA are doing with Neo4j Graph Data Science.
Share Article


Explore
Related Articles

Neo4j Named “One to Watch” in Snowflake’s 2026 Modern Marketing Data Stack Report

POLE+O: The 5-Type Ontology That Solves the Hardest Part of Building a Knowledge Graph

1 of 3: The difference between a graph, a knowledge graph, and a context graph
