
How to Graph an ERP System in 3 Easy Steps

Senior Cloud Partner Architect, Neo4j
7 min read
The use of ERP (enterprise resource planning) among businesses, especially larger ones, is widespread across global locations, handling multiple data types for sectors like finance, customers, suppliers, employees, and products. This results in huge data systems with massive intersections and large-scale data user networks.
Because of the breadth and sometimes mystifying data underlying ERP, the resultant information requires a modifier, a holistic way of viewing or visualizing the data to manage it better. For all its usefulness, an ERP system increasingly needs other tools and analytics to make it work better and more effectively for the organization.
The number of businesses using ERP technology is growing, and they are scouting new approaches to help them derive more value from the random and often discursive data they handle. ERPs help a business grow in specified (and unspecified) directions. Nothing is worse than dealing with out-of-date and confusing company information and making easily avoidable data errors because of it. That creates gaps in your schedule and instills chaos among your team(s).
Most Information Technology (IT) professionals have a stake in how best to use a tool, such as ERP, that generates multiple and plentiful datasets in truly useful ways that can be analyzed. ERPs can push data and business information systems to the point of being unmanageable. ERPs themselves require a technology that improves and streamlines their output – one such method is graph technology.
“A graph database gives you ideas from the data, whereas, with most other databases, you have to have the idea and then ask the data.” – Mark Beyer, Distinguished VP Analyst, Gartner
Unlike a relational database, a graph database rests on a specialized platform for creating and managing graphs. Graphs are made up of attributes that are all used to represent and store data in a manner that relational databases cannot. A relational database stores data typically defined by columns and rows, each consisting of a unique dataset so it can be linked only to other rows and tables. But this provides a poor vision of company operations and protocols.
Graph and relational databases handle the same tasks in vastly different ways. Many IT professionals prefer the visual characteristics of graph output over spreadsheet-derived company relations and internal structures.
Purpose
This article is meant for IT stakeholders responsible for running ERP systems to help them learn about, if not use, graph technology to improve their system’s operation. Graph technology will help stakeholders visualize their heterogeneous ERP data from around the world in a single view and analyze them using graph data science. This is crucial for all businesses, particularly those in a high-growth mode.
As various modules and business processes are interconnected, entities have relationships across different datasets. These data domains live in silos, and they exist on different applications in the huge ERP landscape. Having a single view of all the entities with relationships across them is a huge challenge for many ERP stakeholders.
Businesses using ERPs are seeking new technologies that help drive more value from their data. Graph databases, like Neo4j, are helping companies leverage their input to gain better insights and modernize using artificial intelligence and machine learning technologies.
Typical modules in an ERP system include:
- Sales and Distribution
- Production Planning
- Materials Management
- Human Resource Management
- Finance Management
- Professional Services
As various modules and business processes are interconnected, entities have relationships across different datasets, and these need definition and structure. These are data domains, and they exist in different applications in the huge ERP landscape. Having a single view of all the entities with relationships across them is a significant challenge for many ERP stakeholders.
Neo4j is the leading graph database and is offered commercially, fully supported, and open-sourced. One of the benefits of Neo4j is the amount of documentation and easy-to-follow tutorials provided to the end user.
Neo4j Graph Data Science is a data analytics and machine learning platform. With Neo4j, you can more fully understand the connections in your worldwide heterogeneous ERP data, which helps you gain answers to essential business operational questions and improve prediction accuracy.
Utilizing a high-performance graph technology, like Neo4j, on top of various ERP data domains provides operational excellence within the business and improves customer experience. We’ll see how Neo4j can help ERP customers with those specific objectives.
Graph technology provides a vision and shines a light on business operations – without it, IT personnel are “guessing” at corporate ERP data output.
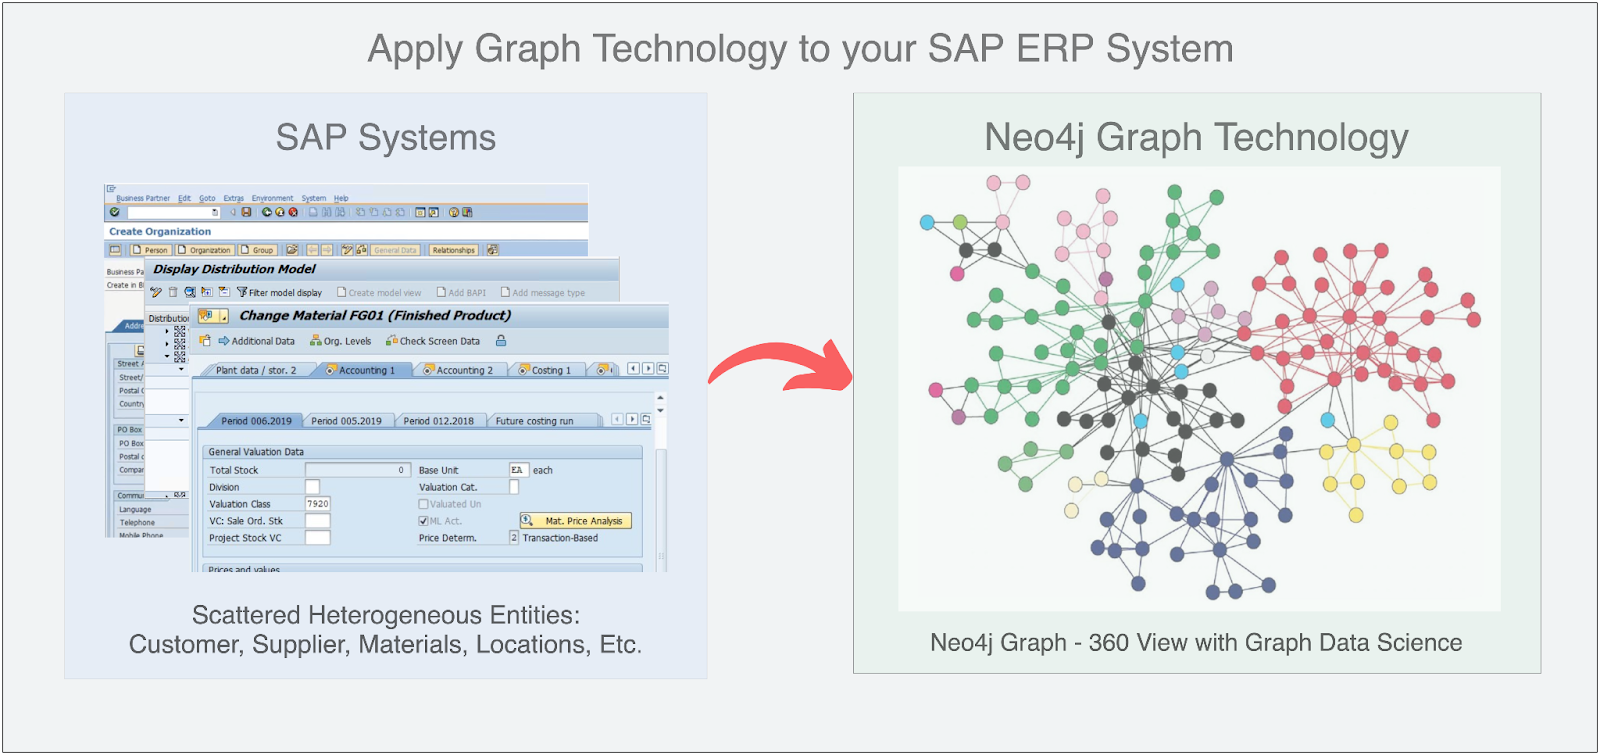
Fig 1: Imagine your highly interconnected ERP data in a blazing-fast graph
How Can Graph Technology Help an ERP System?
ERP systems are used widely by manufacturing companies that have locations across the globe processing various types of data. Having graph database technologies will add to the capabilities of businesses to visualize interconnected relationships better, and to analyze and plan strategies more efficiently using AI/ML technologies. Neo4j Graph Data Science is the only connected data analysis platform that unifies the ML surface and graph database into a single workspace.
ERP business partner organizations (like customers and suppliers, for example), materials (raw materials, finished goods), and functional locations are all related entities. Typically, ERP systems are distributed globally. Graph databases store those entities in nodes and use edges to house relationships among entities. A graph technology like Neo4j will help ERP users easily visualize, analyze, forecast, and plan business functions efficiently and, more importantly, effectively.
Technical, How So?
Let’s see how the magic happens.
“ERP systems will not exhibit their full potential unless they are properly integrated with other enterprise software applications.” ~Alexis Leon, Author
To achieve the integration with SAP, we propose that you adopt our strategic partner Google Cloud Platform (GCP), which offers the Neo4j graph database, delivered seamlessly, and integrates with GCP platforms: GCP console, billing, and support services.
GCP offers various connectivity alternatives to SAP systems to extract data from SAP. GCP loads ERP to the Neo4j database to apply graph data science algorithms and to see the analytics they do not typically have access to in their siloed ERP applications. Here you can get a high-level overview of how to move data from an ERP like SAP to a Neo4j graph database in only three steps.
Step 1: Extract data from SAP to BigQuery using GCP SAP connector
BigQuery is an enterprise data warehouse that helps in analytics with built-in features like machine learning, geospatial analysis, and business intelligence. You can replicate SAP data into BigQuery using the BigQuery connector for SAP with SAP LT Replication Server.
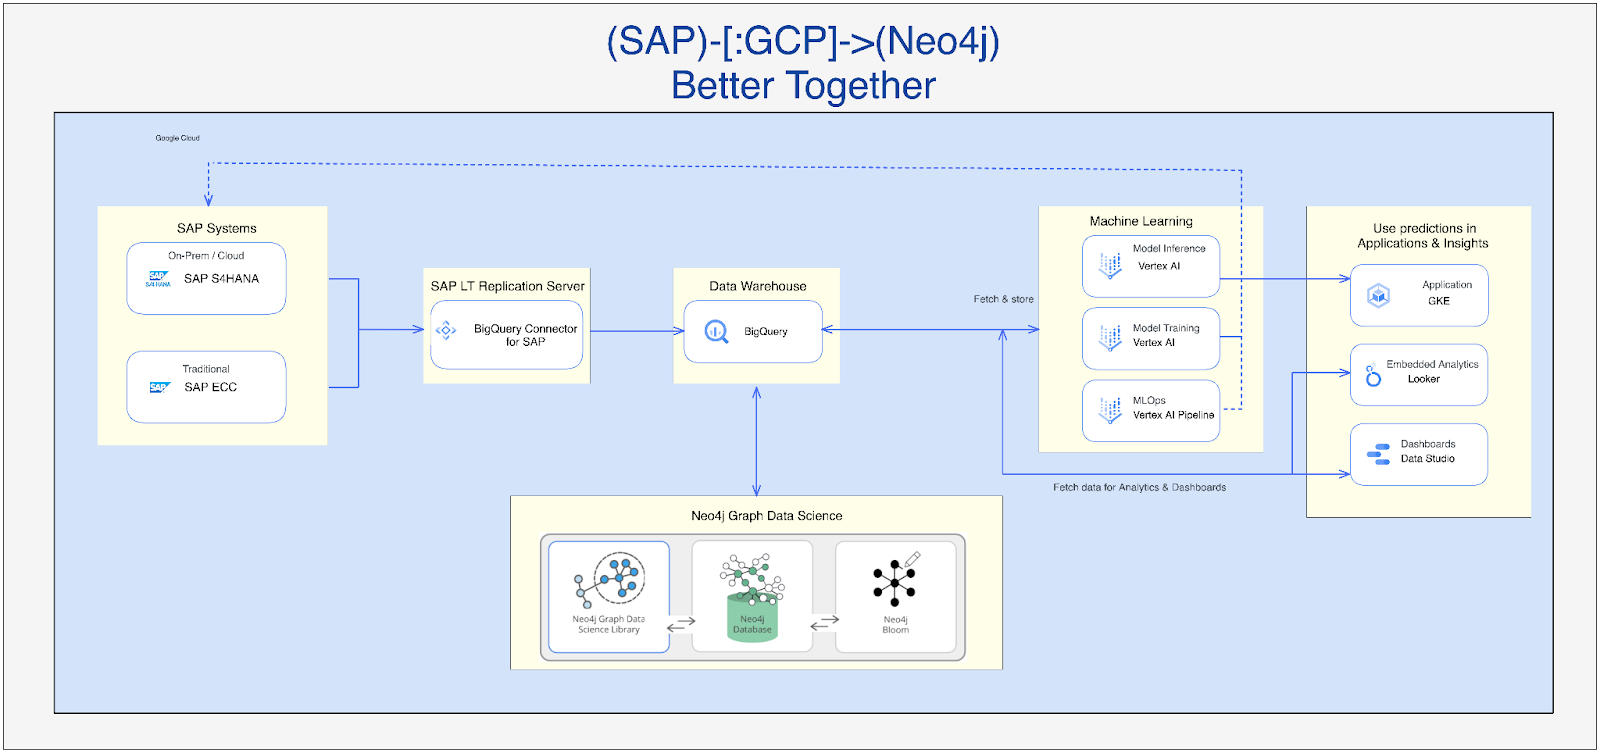
Fig 2: Using Neo4j in GCP Platform
Step 2: Export ERP data from BigQuery to Neo4j
There are several ways we can export data from BigQuery to Neo4j, and Google Cloud Dataflow is one of the ways.
Dataflow is a fast, serverless, no-ops platform for running Apache Beam pipelines. Most Google customers will run Dataflow as a hosted service that auto-scales computing. Neo4j has flexible templates for Google Cloud Dataflow, supporting complex ETL processes through configuration while not requiring coding. The Flex templates provide cloud-native data integration without managing complex ETL processes.
Please refer to this article for more information on how to load data into Neo4j with Google Cloud Dataflow.
Step 3: Gain advantages by analyzing ERP business data in Neo4j
Here’s where the fun begins. With the ERP data loaded into the Neo4j graph, we can explore the whole ERP system from a single pane of glass. Figure 3 below shows Business Partners, Address, Orders, Products, Product Lines, etc., from the SAP Bike Shop sample database in Neo4j Bloom. Neo4j Bloom is a beautiful and expressive data visualization tool that quickly explores and interacts with Neo4j’s graph data platform – no coding required.
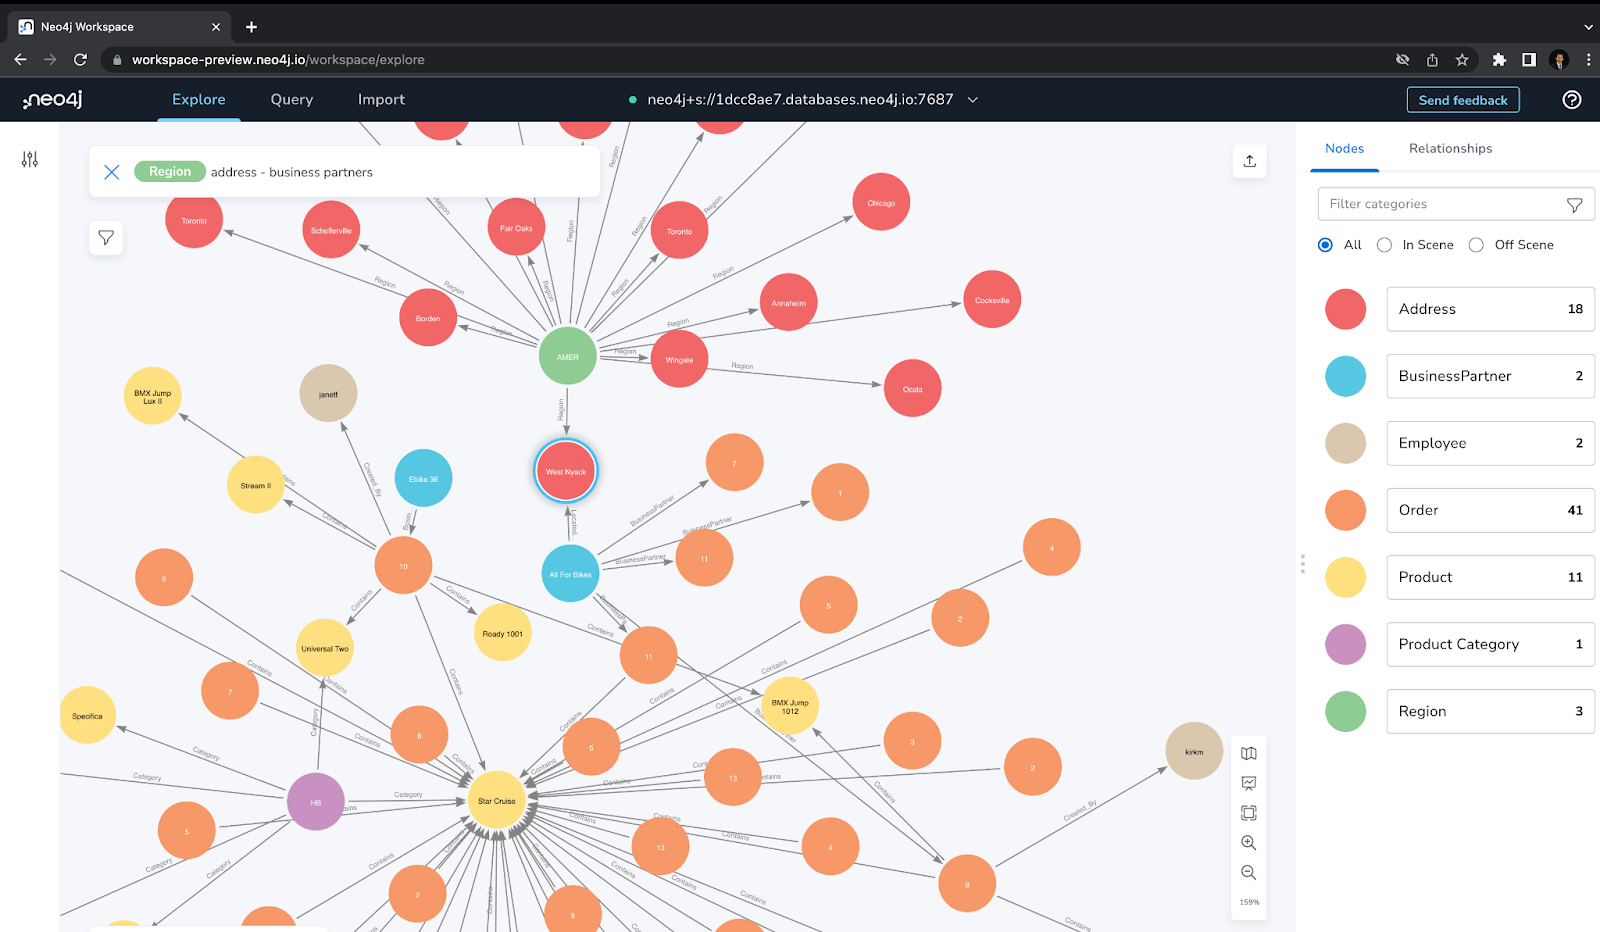
Fig 3: Neo4j Bloom – Data Visualization Tool
For any company, especially in manufacturing, managing a supply chain with high customer satisfaction is one of the most challenging tasks in the IT arena. Supply chain management is also very dynamic. Since the beginning of the pandemic, many companies have wrestled with global supply chain functions and operations.
Graph technology is essential to various supply chain operations. It will optimize the flow of goods, uncover vulnerabilities, and boost overall supply chain resilience.
You can learn more about how graph technology is helping manufacturing companies that are currently leveraging Neo4j graph technology in their supply chain use cases here.
- Over 65 pre-tuned graph algorithms and machine learning models are used to analyze connected data. The analytics and graph database is fully integrated as a single unit.
- There are many easy-to-use features, like the ability to load data into a graph from any source and data pipeline tools integration.
- There are built-in machine learning capabilities like a Native Python API client and a single API for data load, analysis, and write-back.
The graph database focuses on data relationships, helps answer critical questions, and makes operational predictions using highly curated data. A connected graphical view provides an in-depth analysis of patterns and insights with analytical dashboards. Neo4j and Vertex AI make building ML models on top of graph data quick and easy.
Wrapping Up
Neo4j Graph has successfully helped many ERP customers in various use cases, like fraud detection and analytics, a 360-view of customers, corporate identity and asset management, supply chain management, and a business knowledge graph. Discover how you can gain more value from your ERP data using the Neo4j graph on Google Cloud.
You can get started with Aura Pro on GCP here. In our next blog, we’re going to walk through importing with Neo4j Data Importer from SAP Samples on GitHub. We’ll discuss exploring it in Neo4j Browser and Bloom as well.
Share Article


Explore
Related Articles


