The graph of thrones [Season 7 contest]

Head of Product Innovation & Developer Strategy, Neo4j
4 min read
Today launches the seventh season of “Game of Thrones” with many exciting developments awaiting the audience.
Even if we might never see the last two books Winds of Winter and A Dream of Spring published, the TV series producers march ahead and have created their version of events in Westeros.
So like everyone else, we encourage you to become part of the Game of Thrones activities in the next two months.
Publish graph + Game of Thrones content = win prizes
If you create or publish graphy Game of Thrones content that uses Neo4j, graph visualizations, graph algorithms, combines datasets or any other interesting variants, you’ll be eligible for our weekly GoT prize.
The prize is a Game of Thrones T-shirt of your choice plus EUR 50 worth of GoT paraphernalia (sorry, no swords), e.g., from Elbenwald or similar outlets.
For instance a bag that shows your allegiance to House Stark.

We’ll award seven of these prizes while the series runs, with the first going to Tomaz Bratanic for his already amazing, ongoing blog post series.
If you have any questions around this challenge, please join our Discord Group and ask in the #game-of-thrones channel.
Graph visualizations of Westeros
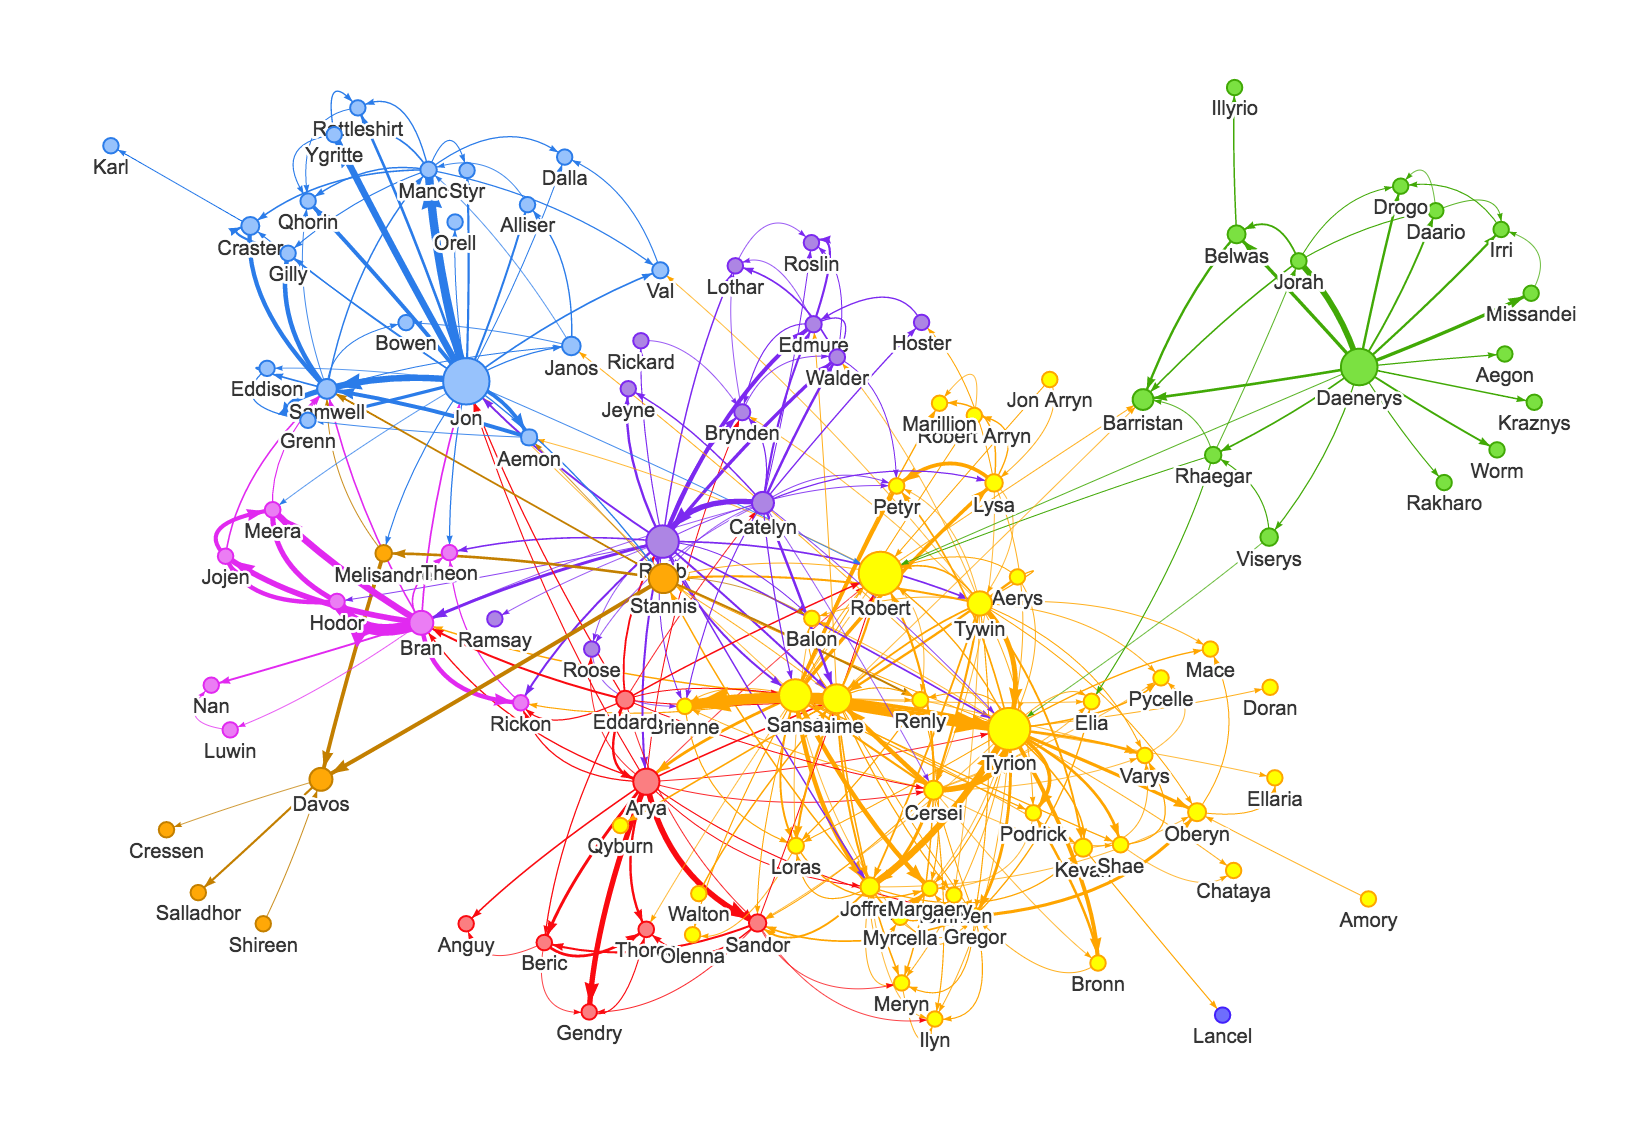
As you might have already noticed, the complexity of relationships in the world of Westeros demands a graph visualization.

I am always impressed how applying network analytics on this dataset yields similar insights as reading and understanding the books would give us in terms of relevance of people and events.
First Game of Thrones GraphGists
The first, very basic graph of the Houses of Westeros in an initial GraphGist.
Here is a much larger dataset, that was also published as a GraphGist.

Teaching graphs with Game of Thrones
We also used Game Of Thrones to teach graph databases at Women Who Code workshops in London.
My colleague Mark Needham scraped the GoT Wikia data (and some more sources) to use as the dataset.

You can find the data and code here and run the Neo4j Browser guide with :play got_wwc
Analysing GoT character co-occurrences
Will Lyon published a Network Analysis of the Game of Thrones based on a dataset of character co-occurences in the third book, A Storm of Swords, published by Andrew Beveridge and Jie Shan.
Will imported the data into Neo4j and shows how to gain insight into the relevance and connections of people by just running a few queries and graph algorithms.
You can run the same data in your Neo4j Browser using :play sandbox/got
You can find all that data and the browser guide in the graph algorithms Sandbox
I’m extremely excited that Andrew tweeted that they now have all five of the Song of Ice and Fire books processed and the data published.
Winter is coming in 2 days. Check out my network analysis of all 5 books. https://t.co/tjR8543Ijv #GoT #asoiaf #math #NetworkOfThrones
— Andrew Beveridge (@mathbeveridge) July 14, 2017
neo4j-graph-algorithms library, analyzing the data is easy, as you can see in Sandbox and Browser Guide.
Analysing Kaggle data
As mentioned in the beginning, Tomaz Bratanic did a great job already in his Game of Thrones series to import the data from Kaggle into Neo4j.
And now with his fourth post, he started to analyze it to draw the first insights around battles, deaths and allegiances.
Here is the approach:
Create a network of persons that fought on the same side in the year 299.
MATCH (p1:Person)-[r1]-(b:Battle {year:299})-[r2]-(p2:Person)
WHERE type(r1)=type(r2)
MERGE (p1)-[:FRIEND]-(p2)
Run the algorithms and write back the results as a property of the node community.
CALL algo.unionFind('Person', 'FRIEND', {write:true, partitionProperty:"community"});
Show the results of the computation.
MATCH (p:Person)
RETURN p.community as community, collect(p.name) AS members, count(*) AS count
ORDER BY count DESC LIMIT 10
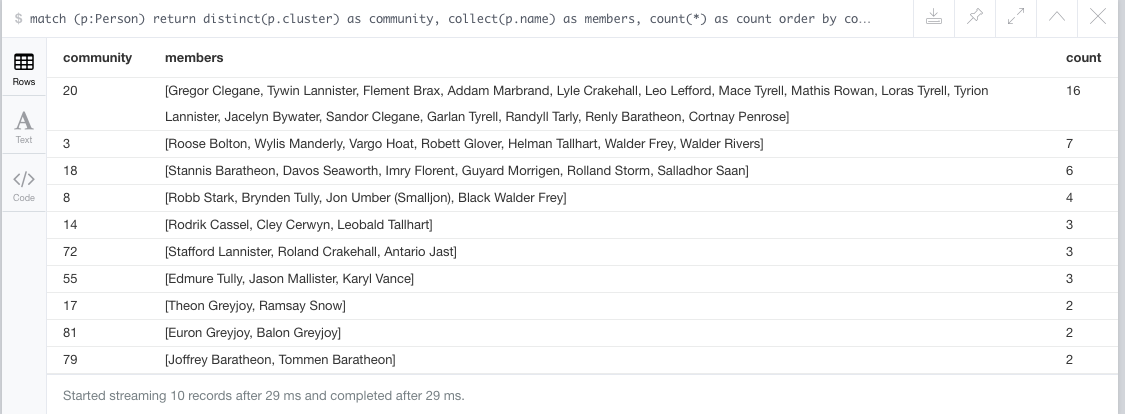
We observe that 10 different communities (partitions) exist.
It is a good representation of the state of alliances that fought together in that specific year.
We could do this analysis for a couple of different years and compare alliances over the years on how they change.
So have fun watching the new Game of Thrones season, and if you haven’t already, then don’t forget to read the books as well.
And instead of feverishly awaiting the next episode, publish some graph fun with Game of Thrones data and you could be one of our lucky winners.
Cheers,
Michael
Share Article


Explore
Related Articles

SumoDB in Neo4j: Chaining Multiple Graph Algorithms in Snowflake — Part 3


Why machines need embeddings: Turning graph structure into features

Finding hidden bottlenecks in flight networks with Aura graph analytics on Databricks