Graph-Specialized ETL: Taking Citizens into the Graph and Keeping It up to Date

Project Manager, Kale Yazılım
6 min read

Editor’s Note: This presentation was given by İrfan Nuri Karaca at GraphConnect Europe in April 2016. Here’s a quick review of what he covered:
–
What we’re going to be talking about today is how we took citizen data into graphs, how we keep it up to date, and how that inspired us to create a graph specialized ETL:
Managing Zettabytes of Data
According to a report by the EMC, the estimated size of the digital universe in 2020 is 44 Zettabytes. This is a huge volume of unstructured data that will change extremely quickly. Fortunately, to handle this data we have NoSQL solutions, big data computing platforms such as Hadoop and Spark, and advanced search engines.
But the report also estimates that there will be 32 billion connected devices by 2020, which makes the solutions listed above not enough; luckily we have Neo4j to handle all of the data connections.
We have been working for cities with census data for almost 20 years, and it was getting harder and harder to meet the analytic requirements emerging from customers. We found ourselves trying to create connections with databases.
Using Graphs to solve Citizen Data Challenges
I can remember the moment I was looking up on the board with all of these drawn connections and I said to my colleague, “This is a graph, right?” Within a few seconds of googling graph databases within seconds of searching google for graph databases, we found Neo4j. Since that time we’ve found a huge number of use cases, which I’ll share below.
It was almost impossible to provide ancestral trees online in real-time with relational databases. Heritage shares — which refers to determining heirs and calculating their heritage shares — was really problematic for us before, but now possible with Neo4j. And to perform system-wide searches of the entire database — which no one wanted to do in SQL — can now be easily done in graph, which allows us to locate and help vulnerable citizens.
For example, whether or not this elderly person has a relative living in the same district. We can also track the causes and routes of domestic and international migration with our historical Redis database, so policy-makers can investigate causes and take any necessary actions.
Unfortunately, even though Neo4j is an operational database that supports transactions and provides for easy integration, there are dependencies — such as whether or not a person has a house and psychological barriers — that prevent us to migrating our entire system into Neo4j.
Trends in Database Technology: All Roads Lead to Graph
Let’s switch gears and talk about legacy systems for a moment. The below data is from the BMC and was collected a year and a half ago:
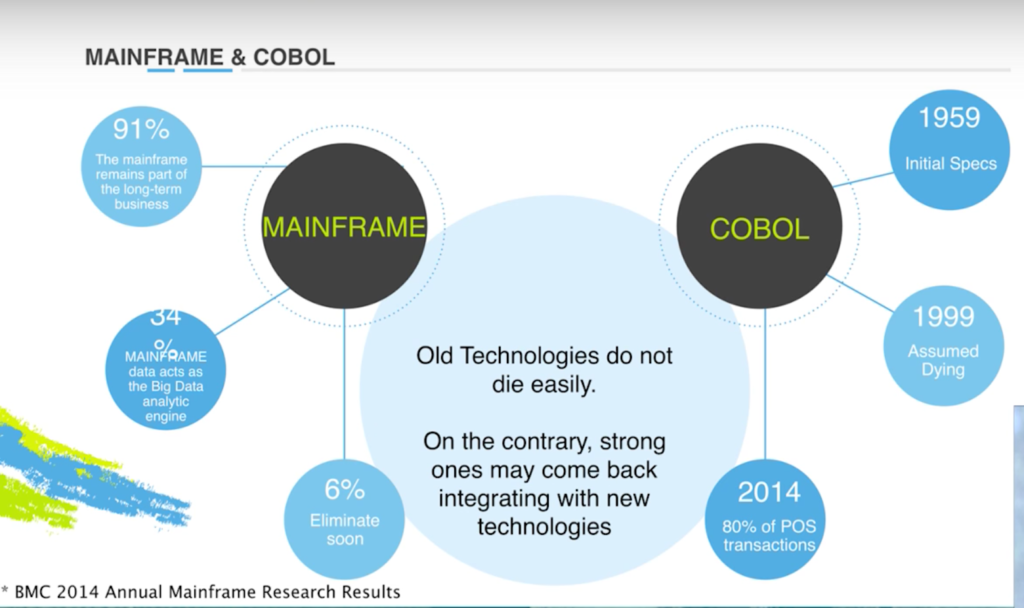
As you can see, 91% of mainframe users think that it’s still a long-term strategy, 24% say that it’s their big data analytic engine, and only 6% are considering eliminating it. A similar pattern holds true for COBOL, which was developed in 1959. I saw a post in 1999 saying that COBOL was going to die out, but in 2014 80% of POS transactions are still created on COBOL code.
I’m not saying that COBOL has a bright future, but what I can say is that old technologies don’t die very easily. On the contrary, they may come back and integrate with new technologies. For example, on GitHub there’s a bridge from COBOL to NodeJS, which is really cool.
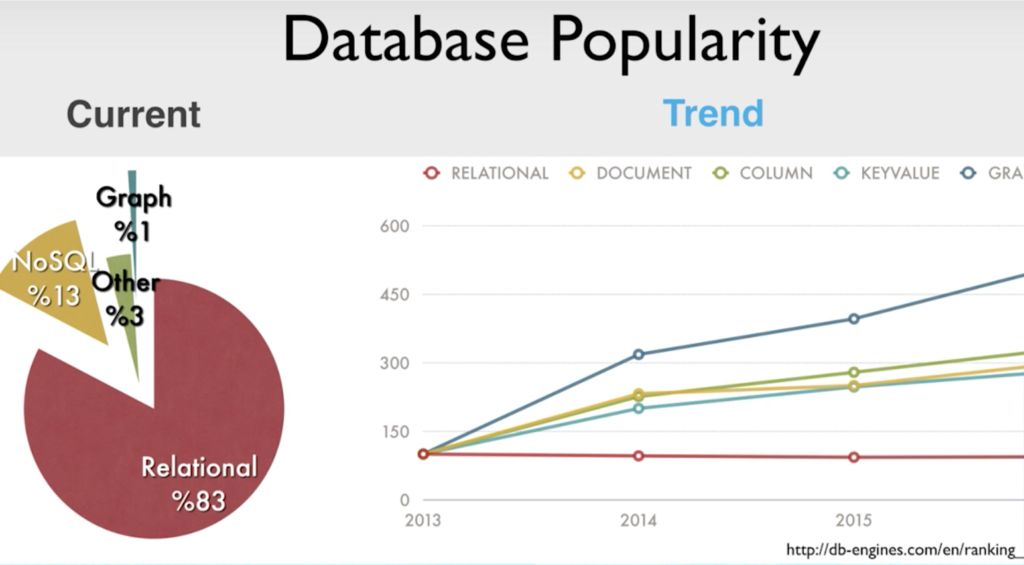
Now let’s take a look at database popularity trends:
Relational databases still dominate the market, but graphs really have a presence, and it’s trending up and up and up. So even though the majority of people are still using relational databases, they can’t resist the appeal of graph databases because they allow you to discover and reveal connections — like surfing.
You already have connected data, but not the surfboard that allows you to easily get through it. And I suppose you can learn how to surf in a few weeks, but you can use Cypher in a matter of hours. You can use graph databases either with a good relational database or with Cypher and surf on the data.
So — why are we going over this? We know that you have to provide more than just tool to migrate data from SQL to graph. You have to make it as easy as pie so that everyone has a chance to use graph databases at scale.
Overcoming Data Integration Challenges
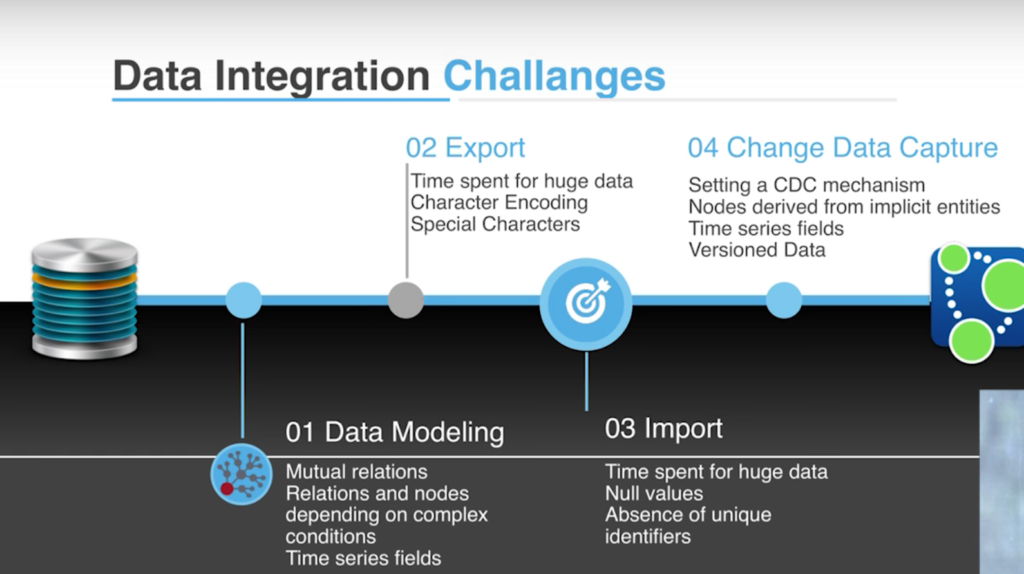
Unfortunately, it’s not that simple. As I mentioned in my blog post, we are dealing with system data in a legacy system that brings some tough challenges:
When you start to transfer the data from SQL to graph, you have to pay close attention to your data model. For us, we’re dealing with mutual relationships with people, including those main relationships and those originating from implicit tables. Another challenge is exporting huge amounts of data, which takes time. And if you don’t consider character encoding problems, special characters, et cetera, you have to roll back the process and start again.
Importing data also has its own challenges. This includes the presence of null values, an absence of unique identifiers, and changing data capture, which requires that you change the capture mechanism — and there’s no universal solution for it. For example, there’s no mechanism that keeps track of implicit nodes or views.
So how did we overcome our data integration challenges?
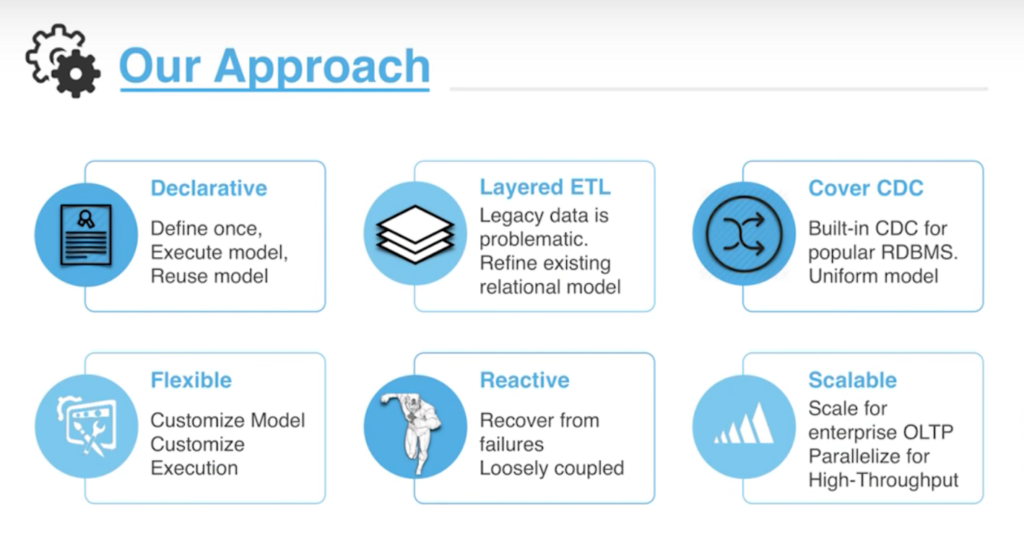
First of all, we say there has to be a complete solution that is declarative. We have to define our transformation such that we have SQL data here that transforms into graph data — it should be as easy as that, and we’ll be able to execute and use that model. I also mentioned that layered legacy data is problematic because it has errors and isn’t refined. And unfortunately you can’t change it because it’s a master data source.
But there is a middle ground that allows you to find your model to prepare for transforming your data for graph. To do that, we have to provide built-in change capture mechanisms for popular RDBMS products that are provided in uniform models, don’t affect your data source chains, and is both reactive and flexible. People want customizations in both their model and execution process, because your source data is not under your control and will cause exceptions — it lacks integrity and quality.
For the system to have the ability to recover from failure, it has to be loosely coupled to support multiple domains. It also has to be scalable because most legacy systems have a large number of transactions, so it has to be able to scale for enterprise online transaction processing, and it should be parallelize for high-throughput.
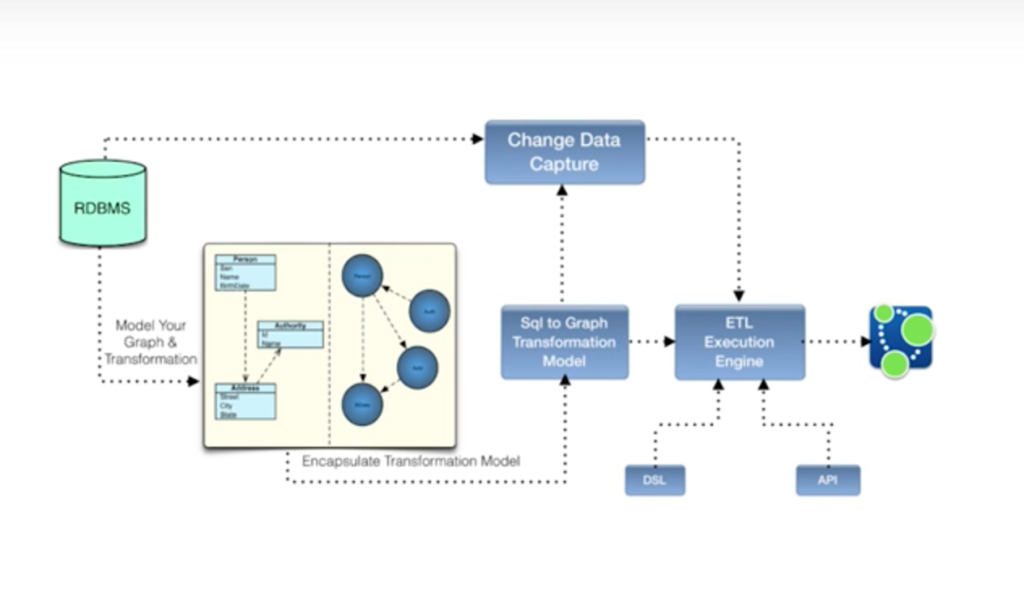
Let’s see what this type of system looks like in a diagram:
We have an RDBMS database at the beginning of our data model. Then we have a graph model and transformation via a visual designer tool, which we encapsulate as an SQL-to-graph transformation model. We pass this model to an ETL execution engine, which loads the data and hands it over to your graph database.
If you want customization, you can make use of a DSL or API. Because we had already captured or changed the captured logic in our model, this law model could easily be passed to the ETL execution engine so that we can keep our databases synchronized.
Below is a short demo that demonstrates how such a model. We have data sources and data sets. We know data sources are connections to the databases, and data sets are our source for subject transformation.
You can learn more about graph database specialized ETL on the Neo4j blog, or on the Kale Yazılım Twitter, Facebook, or via email.

