
Using Graph Technology for Environmental Data Compliance and Implementation

Neo4j Contributing Writer
4 min read
Some organizations embrace sustainability and incorporate it into their organizational design. In fact, businesses that make their sustainability information public are more successful. The American Accounting Association found that “the median value of firms that voluntarily disclose their carbon emissions is about $2.3 billion higher than that of comparable non-disclosing firms.”
From a marketing perspective, environmental data transparency boosts a business’s reputation. Internally, it improves employee outlook of the business and makes them feel more engaged. With tighter sustainability metrics, businesses can make smarter decisions that lead to less risk and more financial gain. Complying with environmental regulations means smoother operations – and this also means a better reputation.
Every person, company, and government is going to be affected by climate change, which is why we are already seeing increasingly demanding regulations from environmental agencies and can expect to see more at the state, national, and international levels. All organizations are going to be faced with the challenge of complying with these new, shifting, and overlapping environmental regulations.
With sustainability data being so dynamic, Neo4j’s graph database provides a solution to make data capture, measurement, and aggregation both simple and effective.
With both regulatory and corporate drivers for sustainability pushing the demand for new metrics across all sectors, we must capture greenhouse gas emissions data by identifying consumption and point sources of pollution in the energy-water-waste nexus. In addition to capturing the data, we must also track, monitor, verify, and report this data to make more intelligent and efficient choices for the environment by reducing our greenhouse gas emissions.
The simple data modeling behind graph databases makes it relatively easy to model complex processes. As a result, many organizations use graph databases to create digital twins for their complex work. A digital twin is a virtual model of all the relevant processes, mimicking how each process interacts with the others. Because graph databases are so flexible, once a set of processes – such as production data – is linked together, it is easy to add additional output data on top of this, like emissions and environmental compliance.
Drilling Into Data for Sustainability

I keep a lookout for solutions to environmental problems involving complex data, so I was excited to watch Michael Moore, Neo4j’s Principal Partner Solutions Technologist, present Carbon Tracking and Analysis with the Neo4j Graph Data Platform at the Energy Conference Network. Though his presentation was specifically about carbon emissions from oil wells, the data solution can be applied to environmental problems across the sustainability field – from waste generation to water consumption.
For a little environmental law background, the oil industry is a major source of greenhouse gasses and therefore requires increased regulation. As part of the Clean Air Act, the U.S. Environmental Protection Agency proposed regulations to reduce greenhouse gas emissions from oil wells. New EPA guidelines will require intensive screening using technology to identify fugitive emissions that go beyond the 10 kg/hr per well threshold, which is what Michael helped visualize in a digital twin.
Understanding the sources where carbon is being emitted from is key to managing it. As you can see from his digital twin, you can visually trace where the data comes from and how processes are connected. Once a digital twin is built, not only is it easy to link in relevant environmental and compliance data, but as requirements change and new measures are added, it’s simple to make changes to your data model because Neo4j is schemaless – just add new nodes to represent the outputs of a process and relationships to represent how those outputs move from one process to another.
A Flexible Data Model
One challenge that presents itself in any compliance measurement is the level at which someone needs to report. For instance, do you want reporting at an individual sensor level? For a particular piece of equipment? For a whole field of equipment? For all the equipment within a specific region? The required aggregations for compliance metrics can differ across regulatory bodies.
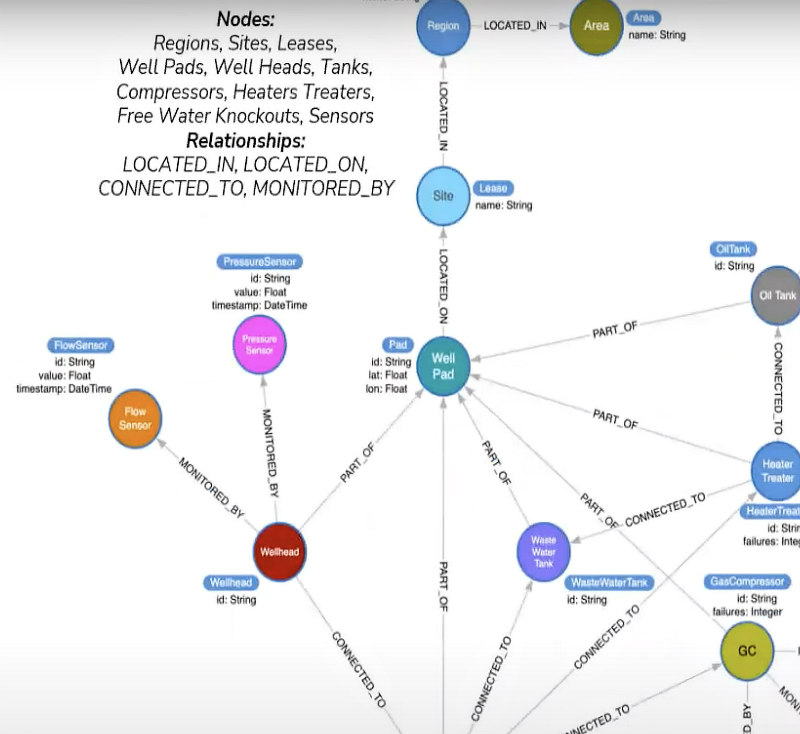
Here is the compliance data model Michael shared to identify sources of carbon emissions:

From drilling into the data to find point sources of pollution in the industrial processes, you can see in the digital twin above how a hierarchical shape unfolds:
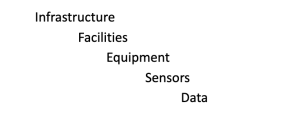
It is fitting that the data be presented in a hierarchical shape to allow for flexibility, and a graph database allows this structure to be easily visualized and malleable.
Graph Visualization
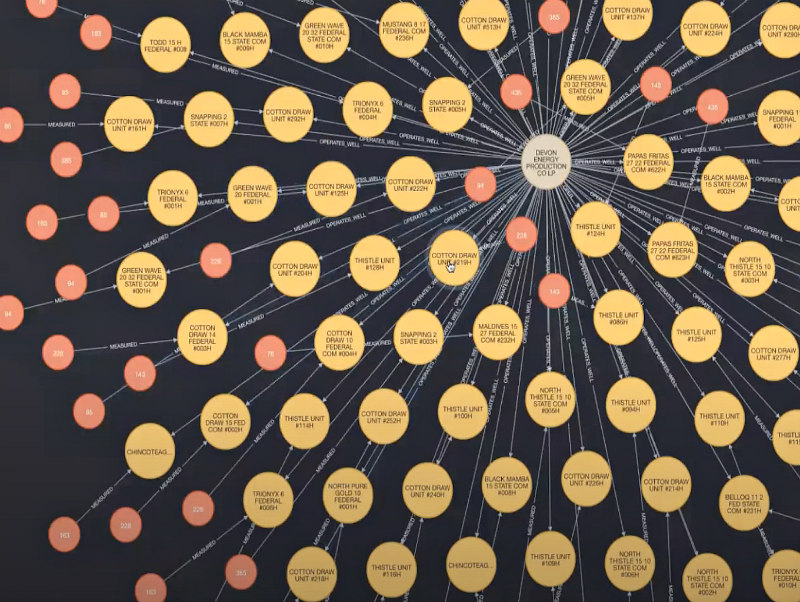
With the visualization capabilities built into graph databases, you can easily see environmental problems highlighted in the data by region, site, or equipment. Once you have all your data collected, through remote sensing and other methods, you can identify problems and move into ground truthing by sending people into the field to verify data and fix compliance-related issues. Perhaps you prioritize sending technicians to the wells leaking “well” – above 10 kg/hr – before then moving on to the wells that are slightly above that threshold.
As seen with this carbon management method, graph databases are flexible tools to track, visualize, and analyze data and effectively address environmental hazards to meet climate action plans. The more we get corporations on board with regulations to comply with environmental mandates, they will see for themselves the benefits of data transparency – both for their company and for the planet.
Data is crucial to a company’s commitment to sustainability, from using data to maintain equipment to determining next steps for implementation. With emerging regulations addressing climate change, we have to effectively tackle the data – otherwise, we can’t effectively tackle the climate crisis.
Share Article


Explore
Related Articles


What Is Data Lineage? Tracking Data Through Enterprise Systems

15 Best Graph Visualization Tools for Your Neo4j Graph Database

