Graph Visualization Just Got Easier: Introducing Neo4j Bloom 1.4!

Graph Analytics & AI Program Director
2 min read
A few weeks ago, we released Neo4j Bloom version 1.4 with new features to help you get started investigating graphs visually and providing new ways of viewing different types of graphs.
We focused on these areas because, although people perform various types of activities in Bloom, it’s the initial steps that have the most impact on getting what you need done.
You can watch Anurag Tandon, the product lead for Bloom and developer tools, speak about and demonstrate some of the new features at this NODES session.
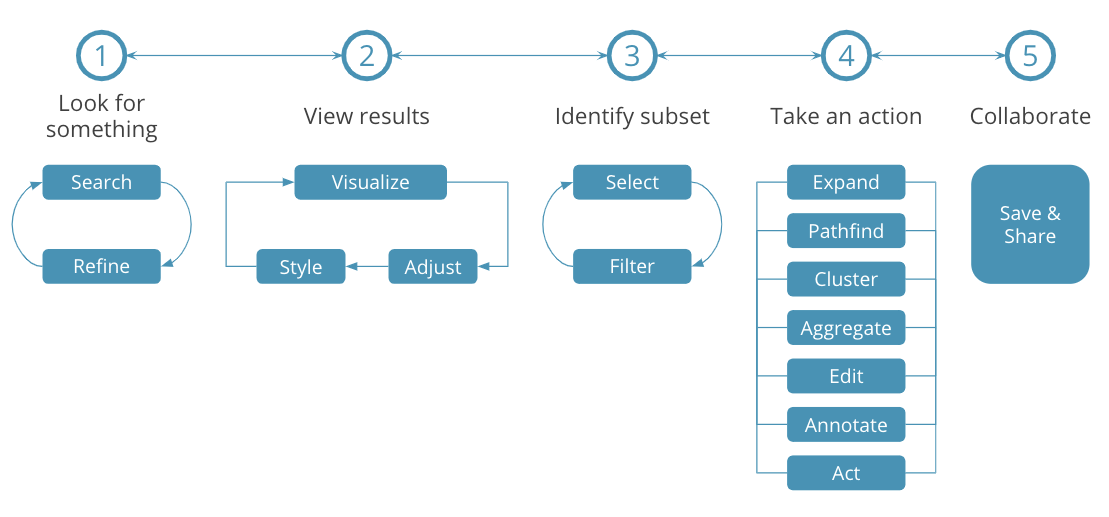
The five different types of activities of visually exploring graphs.
Proactive Search Suggestions
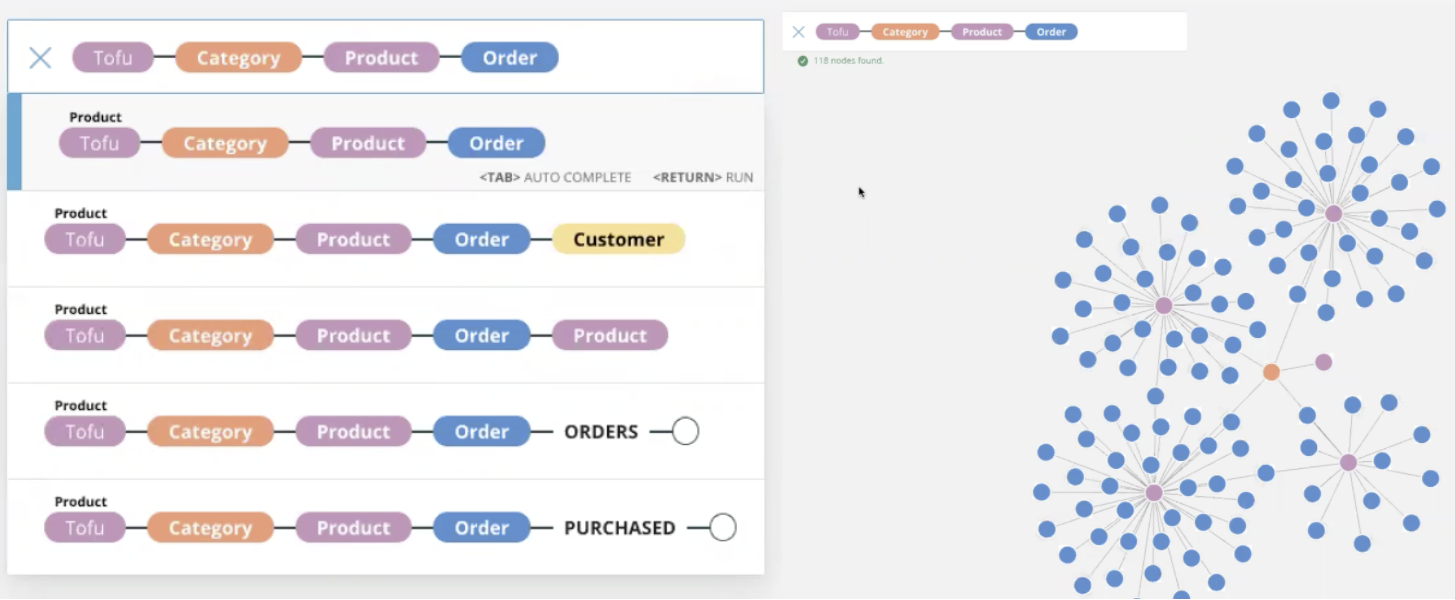
If you’re like me, you don’t exactly know where to start when you’re exploring a new graph, and looking at a blank screen is a bit intimidating. So I was delighted to see and play with the new proactive search suggestions feature that automatically displays linked entities and patterns in the search box.
This means you no longer need to know the underlying data model to get started. And again, if you’re like me, you probably don’t remember all the node and relationship types available in a data set.
With a proactive search, Bloom suggests nodes and relationships you can investigate with increasing detail at each step.
Once you have the level of detail you’re looking for, a graph visualization is returned.
Hierarchical Graph Layout
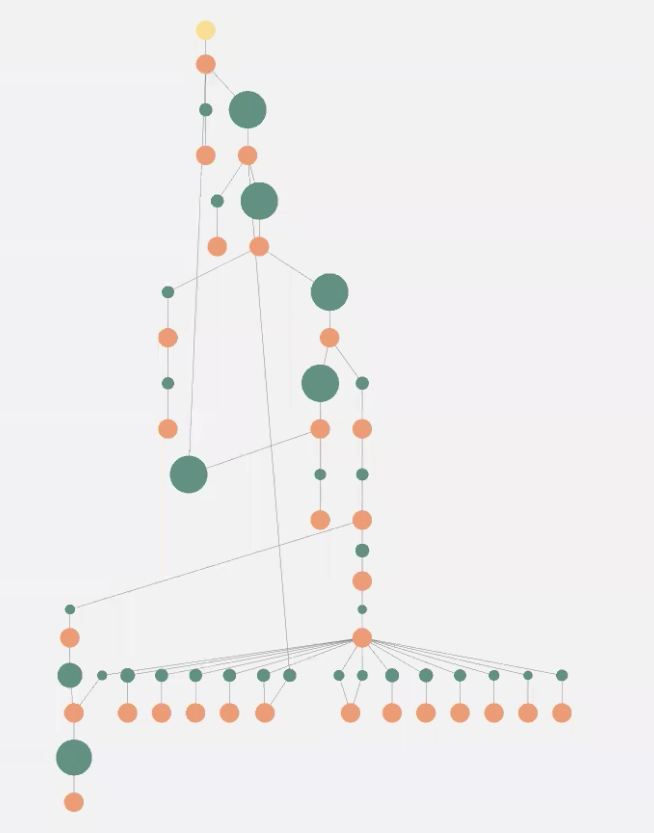
Another nifty addition is a hierarchical graph layout that visualizes nested and sequential data in a tree or linear format. This works perfectly for exploring customer journey data, supply chains and dependency mappings.
The hierarchical layout is one of those features that I didn’t realize would be so powerful until I saw it and could understand the need for it to explore things like product and sub-component dependencies.
Switching to the hierarchical layout lets you view sequential and nested data with a simple toggle.
If you happen to already be a Bloom power user, there are also some features for you in this release.
First, we’ve added user controls for the refresh of perspectives. You can now control when changes in the database should be reflected in a Bloom perspective, thereby easing the load on a larger database from Bloom trying to look for new changes constantly.
We’ve also improved performance by optimizing queries, which you can read more about in the release notes.
If you’re ready to get started, remember: Bloom is free for personal use with Neo4j Desktop and Neo4j AuraDB, our fully-managed cloud service offering. You can also get the server version from our download center.
Cheers!
Amy
Grab yourself a free copy of the Graph Data Science for Dummies book for an easy-to-understand guide to the basics of GDS – no previous background required.
