#GraphCast: Bliss Out to Neo4j Bloom

Senior Manager, Content, Neo4j
1 min read

Welcome to this week’s #GraphCast – our series featuring what you might have missed in Neo4j media from the past fortnight.
Last time, our Editor-in-Chief, Bryce Merkl Sasaki, sent a raven and featured a video showcasing the power of graph analytics with a Game of Thrones dataset. (Eeeee, SUNDAY!!)
For my turn, I dunno… maybe you’re feeling less than cerebral at the end of the work week? I’m raising my hand. Perhaps you just want to stare at some pretty colors while learning about something awesome? Yeah, let’s do that.
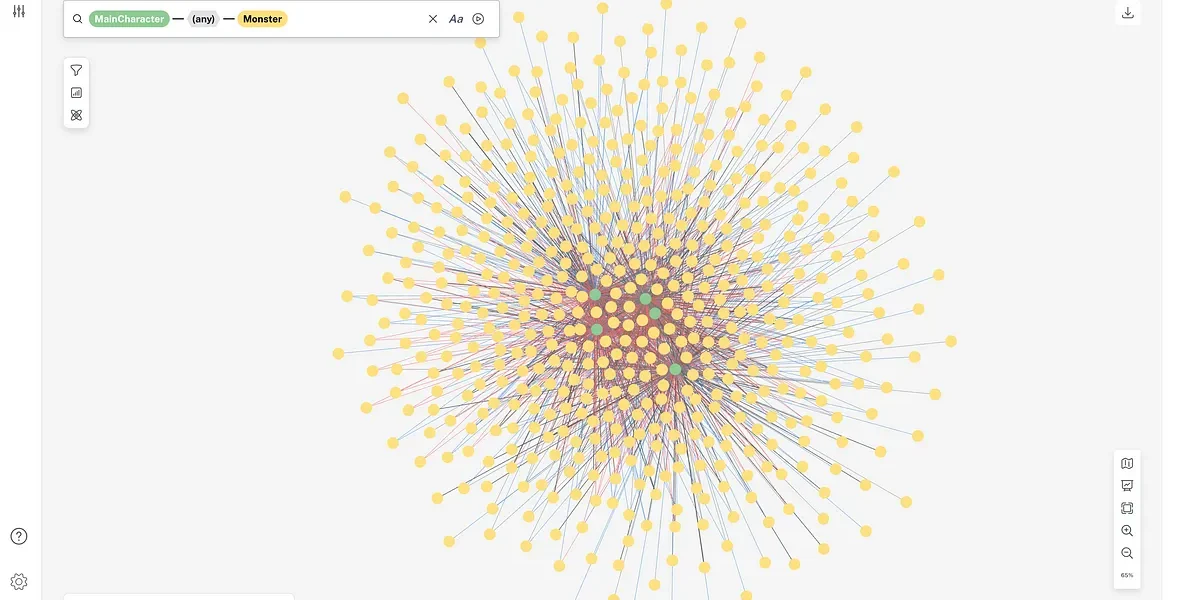
Neo4j Bloom – our data visualization tool that makes graph analytics fun for everyone – is packed with a ton of benefits, but it’s also simply mesmerizing to see in action.
Slump back into your seat, press play and watch Rik Van Bruggen effortlessly investigate fishy data patterns in financial transactions with Neo4j Bloom. Bonus: If your boss walks over wondering what you’re spacing out to, you have something 100% legitimate to show them.
Neo4j Bloom is a breakthrough graph exploration application for visually interacting with graph data. Because of its illustrative qualities, the tool provides the ideal way to communicate patterns in data with peers, managers and executives. It’s also just so darn beautiful.
Catch all our videos when you subscribe to the Neo4j YouTube channel, updated weekly with tons of graph tech goods.


