GraphHack Day Berlin

Head of Product Innovation & Developer Strategy, Neo4j
5 min read
GraphHack Day

Spending a whole day, a whopping 12 hours in total with people interested in learning Neo4j makes me a happy person.
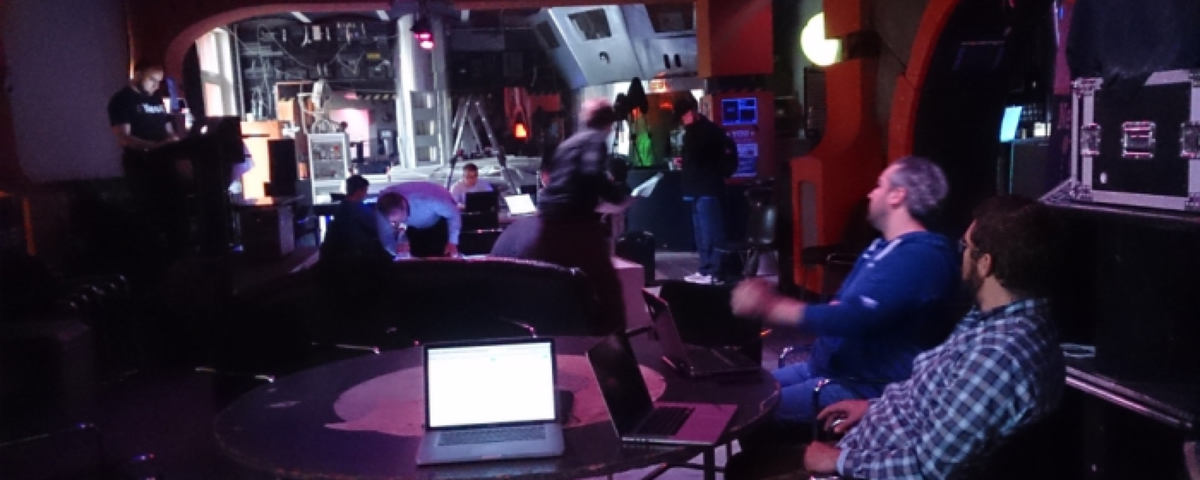
This year we returned to our favorite Space Station in Berlin c-base to host the Neo4j GraphHack-Day co-hosted with Berlin Buzzwords .
Thanks to c-base for being open for us again, my colleague Stefan for doing all the work and to every attendee for being there, curious and willing to learn about that “graph database thing”.
It was definitely worth it.
How it went
As only a few had already used Neo4j, we started the day by me introducing the property graph concepts, aspects of graph databases and running an extensive demo of Cypher in the Neo4j Web-UI.
From creating and querying basic graph patterns via more complex capabilities, towards the import facilities offered by the Cypher language and Neo4j.
The browser with its built in guides were a great help, we really should extend that treasure in the future and make it more findable.
I always related information back to online resources, so it would be easy to go back and read up about them later on.
This time I tried to make the “presentation” way more hands-on, and provided every bit of information and every interesting link upfront at https://bit.ly/graphhack-berlin
After the intro we formed teams and announced the ideas, that the groups wanted to work on for the rest of the day before having lots of Pizza.
I was impressed by the challenge everyone accepted as their own.
The afternoon went by really quickly with everyone being busy coding and asking a lot of questions.
Before the Burgers were served, each team presented their solution and we discussed the approach and pointed out related information or projects.
Here we go …
Josef
created an airfare recommendation system, by importing a subset of many billion rows of fare-, airline- and route-data he had available into a graph model and writing a single cypher query to figure out the cheapest router.
I was impressed how many alternative routes had to be taken into consideration even for just single recommendation.
The results grouped price and time-ranges over routes while adding constraints like max-price and dates.
We had to help cypher a bit to prune the 2-3M alternative paths quickly but we got it down to 300ms.
Christian + Walter
followed an interesting idea of using the graph to represent computer systems, representing: architectures, installations, packages, versions, users, and files.
They used osquery a tool from facebook that lets you treat all system information like a read-only database. Pretty cool tool!!
Using Python to read the data from osquery inspecting a Fedora system, they created the appropriate graph model and combined it with user login information (account, groups, login-source etc).
Combining the two allows you to answer some interesting questions, like which files are currently used by all users logged in from a certain ip-range.
Matthias + Sameer
wanted to visualize metadata of biological models in the biomodels.com database.
They developed a graph model of compartments, reactions, species, model, and RDF-annotation.
Importing 600MB of XML into Neo4j posed the first challenge, mostly around getting familiar with the tools and language but also parsing the raw format.
Querying and visualizing the data there were already some first insights obvious. One was that certain “hyped” biomodels were pretty intensely researched (esp. cancer pathways).
And that the researchers actually didn’t do a good job of annotating their models.
Sameer then used the structural graph search library Popoto.js to make the data accessible.
Matthias also shared their code on GitHub with a really nice and detailed description that explains all the detail I left out here. Thanks Matthias!
For anyone interested in Graph Databases in BioTech please consider joining the neo4j-biotech google group.
Karl-Heinz
had a concrete problem.
He works in a company providing security auditing software for permission resolution in BI environments of user access to resources is only valid for certain timespans.
While their .Net software provides forensics by computing possible past permission chains, they wanted to use graph querying with Neo4j to verify their results for their integration tests.
So after developing the first solution on a well suited graph model himself, he challenged Stefan and me to work out a solution on a not optimal graph model, but we concluded that it would not be efficient to compute on top of that model in Cypher.
Reza, David, Jürgen
Jürgen helping Reza and David who are from chronotics?? a company providing GraphInsight a WebGL based 3d-GraphVisualisation-Solution.
Reza is from Canada just started as an intern so the GraphHack was a valuable Neo4j training experience for him.
They imported bank transaction data into a graph model of accounts, transactions, stores and cities and could visualize the buying behavior of users both with cypher based on facets as well as visually in GraphInsight.
This time they exported the Neo4j graph with additional virtual relationships to CSV to read it into their software but they promised that next time they’ll read it directly via Neo4j’s Cypher remoting API.
Konstantin + Dominique
Konstantin a mathematician and graph lover by trade and Dominique wanted to be able to make public data available for easier querying and finding new insights.
So they looked at abgeordnetenwatch.de a site observing the behavior of members of the German parliament.
Unfortunately their APIs were cumbersome or non-existant so they had to get back to web-scraping.
After importing the relevant data about the politicians they enhanced the dataset with votes on parliamentary decisions.
Looking at the data in teh graph you could quickly see how factions of the 5 parties had very consisten voting behavior but also that there were some outliers.
Due to the data model it was a very dense graph (everyone participated in each vote and everyone belongs to one of the 5 parties).
Ludmila, Vigor and others from Sweden
A Swedish delegation from Stockholm, worked on importing transportation timetables from Stockholm into Neo4j but struggled a bit with pre-filtering the raw data and had to leave early.
I expect them to present their findings at the Friends of Neo4j Stockholm User-Group.
Guenter from Switzerland
Looked into representing multi-lingual keyword data from MACS in Neo4j, which is actually a domain that Neo4j originated from.
He spend a lot of time with the awkward format but with the help of metafactory/structure? he got it imported ready to be queried.
Thanks to everyone
In the end, everyone was a winner and went home with a fully belly, a Neo4j Mug and a book.
Thanks for being there and having so much fun with us.
Quotes
“I wished I knew Neo4j before I embarked on this project.”
“Putting data in a graph is a really powerful way of finding relevant connections”
“Cypher and the Neo4j browser make it really easy to get started”
Cheers, Michael
Want to learn more about graph databases? Click below to get your free copy of O’Reilly’s Graph Databases ebook and discover how to use graph technologies for your application today.


