Graphing space and time

Analytics Project Leader, New York-Presbyterian Hospital
5 min read

Editor’s Note: This presentation was given by Michael Zelenetz at GraphConnect New York in September 2018.
Presentation summary
Time and space are undoubtedly related and paramount, though it’s often difficult to tangibly graph the relationships between the two.
In this post, NewYork-Presbyterian Hospital’s analytics project leader Michael Zelenetz discusses how he and his team sought to combine spatial and time data to understand which procedures and infections happen, where they happen and when they happen.
However, they ran into problems in which these two types of data didn’t always work well together.
Zelenetz and his team turned to graph databases, algorithms and analytics to map out the time and location of certain events in the hospital.
In this post, he puts forth proposed models of graphing time and space data. He also gives some insight into how combining the two, in order, might pave the way for more complex analysis on where and when infections spread and who they might affect.
Full presentation: Graphing space and time
My name is Michael Zelenetz. I work at NewYork-Presbyterian, a big hospital in New York City, though this won’t be a post about healthcare per se.
What I want to discuss is a problem I’ve personally had, and one I’m sure many of you have run into if you’ve been playing with graph databases. I don’t know if I have the perfect answer to this problem, but hopefully this post sparks conversation.
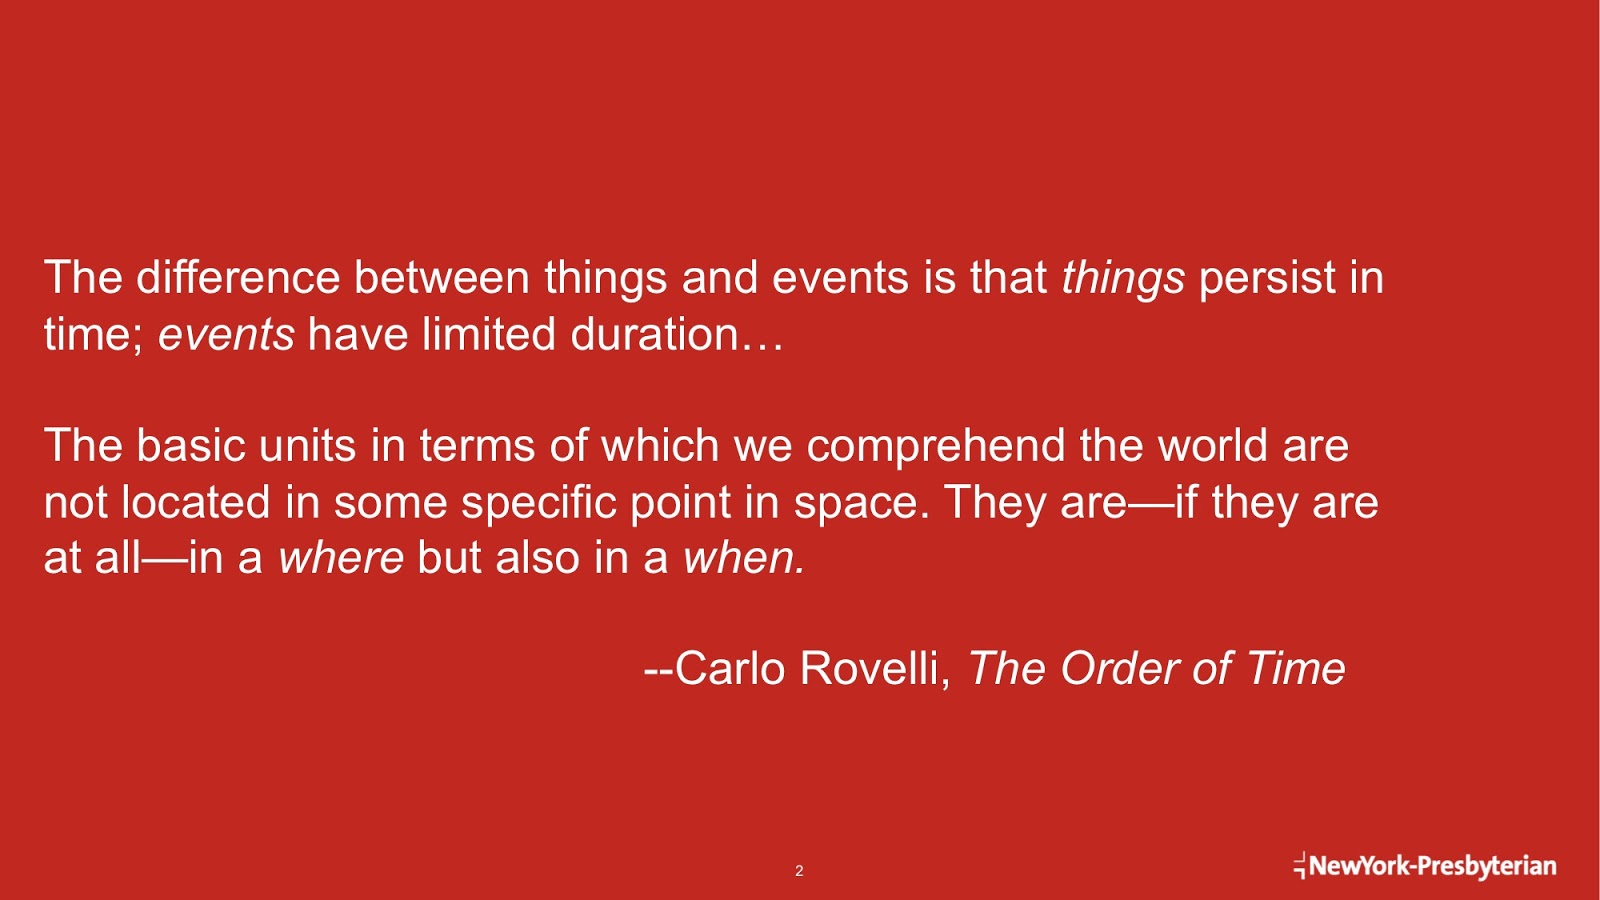
I recently read a book by physicist Carlo Rovelli and he frames this problem very well. He essentially says that things are only interesting insofar as they happen at both a place and a time.
The challenge: Graphing both time and space data
Similarly in the data world, we’re interested in capturing events that are at both a given time and place.
At NewYork-Presbyterian, we wanted to understand where our procedures happen, which procedures happen and when they happen over time. This was the problem we tried to solve.
At GraphConnect 2017, I spoke about a project we started. We wanted to graph everything that happens in a hospital as a social network, much like the one shown in the image below.

We wanted to look at hospital visits, patients and what happened to those patients, specifically at how infections spread throughout the hospital. We sought to see if patient A was in the same room as patient B at the same time they contracted an infection – and that’s why getting both time and location data points together was very important.
With this data, we’d then be able to see which patients may have been nearby, who’s being cared for by the same provider and who was collocated on the same unit. All of this would allow us to perform more advanced analysis on how diseases move around and who might be at risk.
However, we run into this problem where spatial and time data don’t always work well together. For example, you have maps like the one on the left in the image below. It represents many events that happen in certain locations over maybe months, years, seconds – who knows?
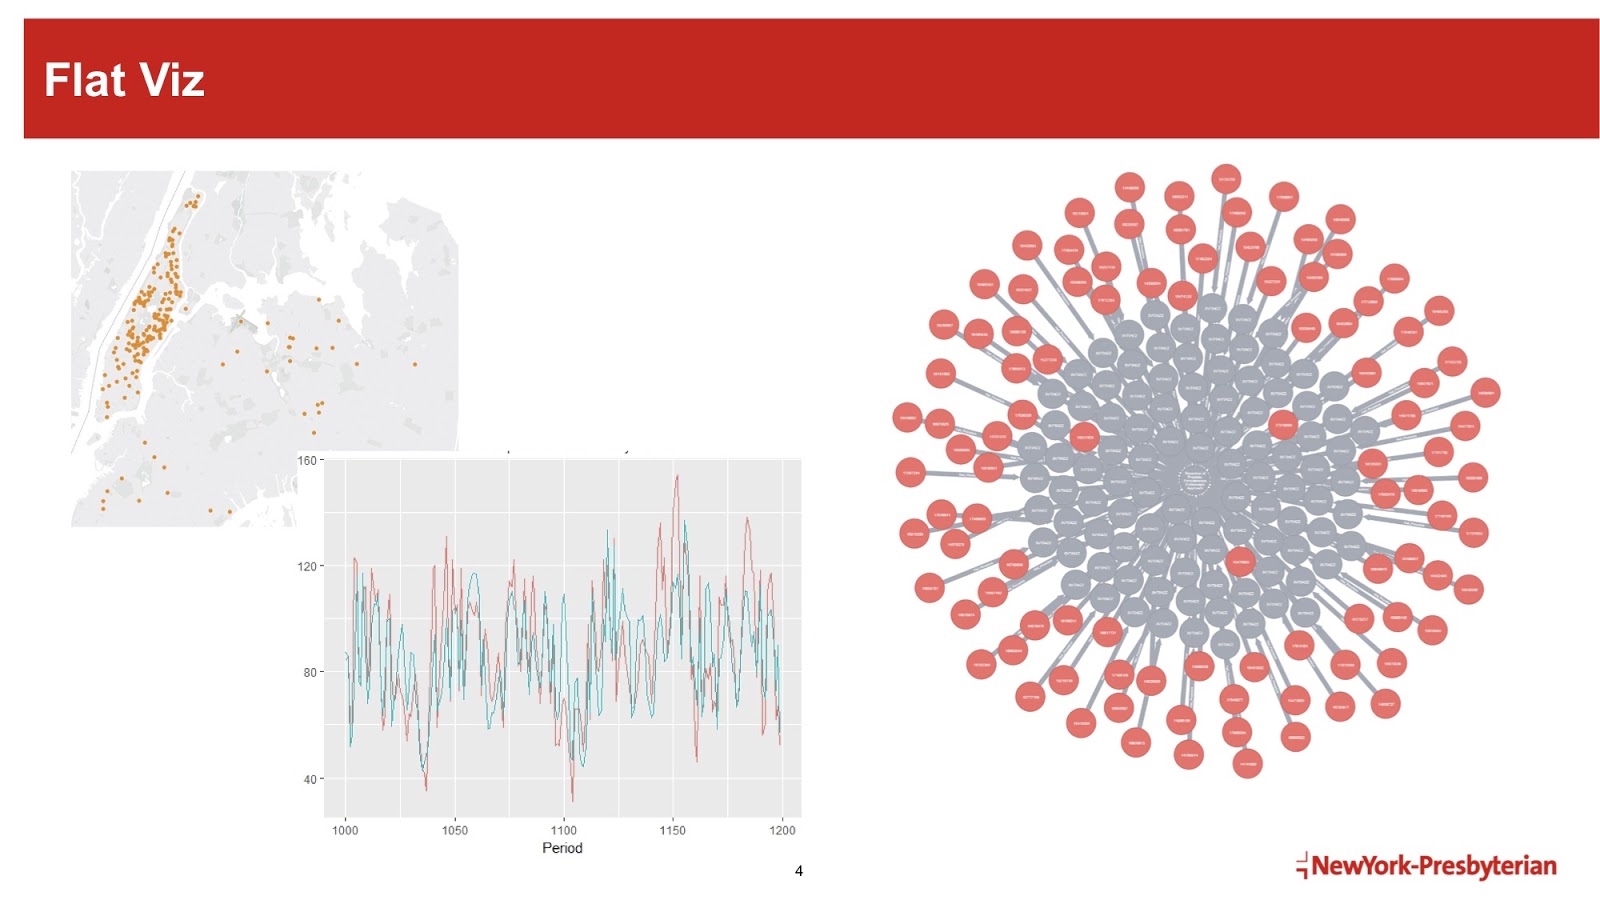
On the other hand, the time series graph in the image shows data in a way that we don’t have a good way of understanding what happened over time versus what happened at a given place.
Proposed models: Combining the data
Here’s my proposed model to combine time and space data:
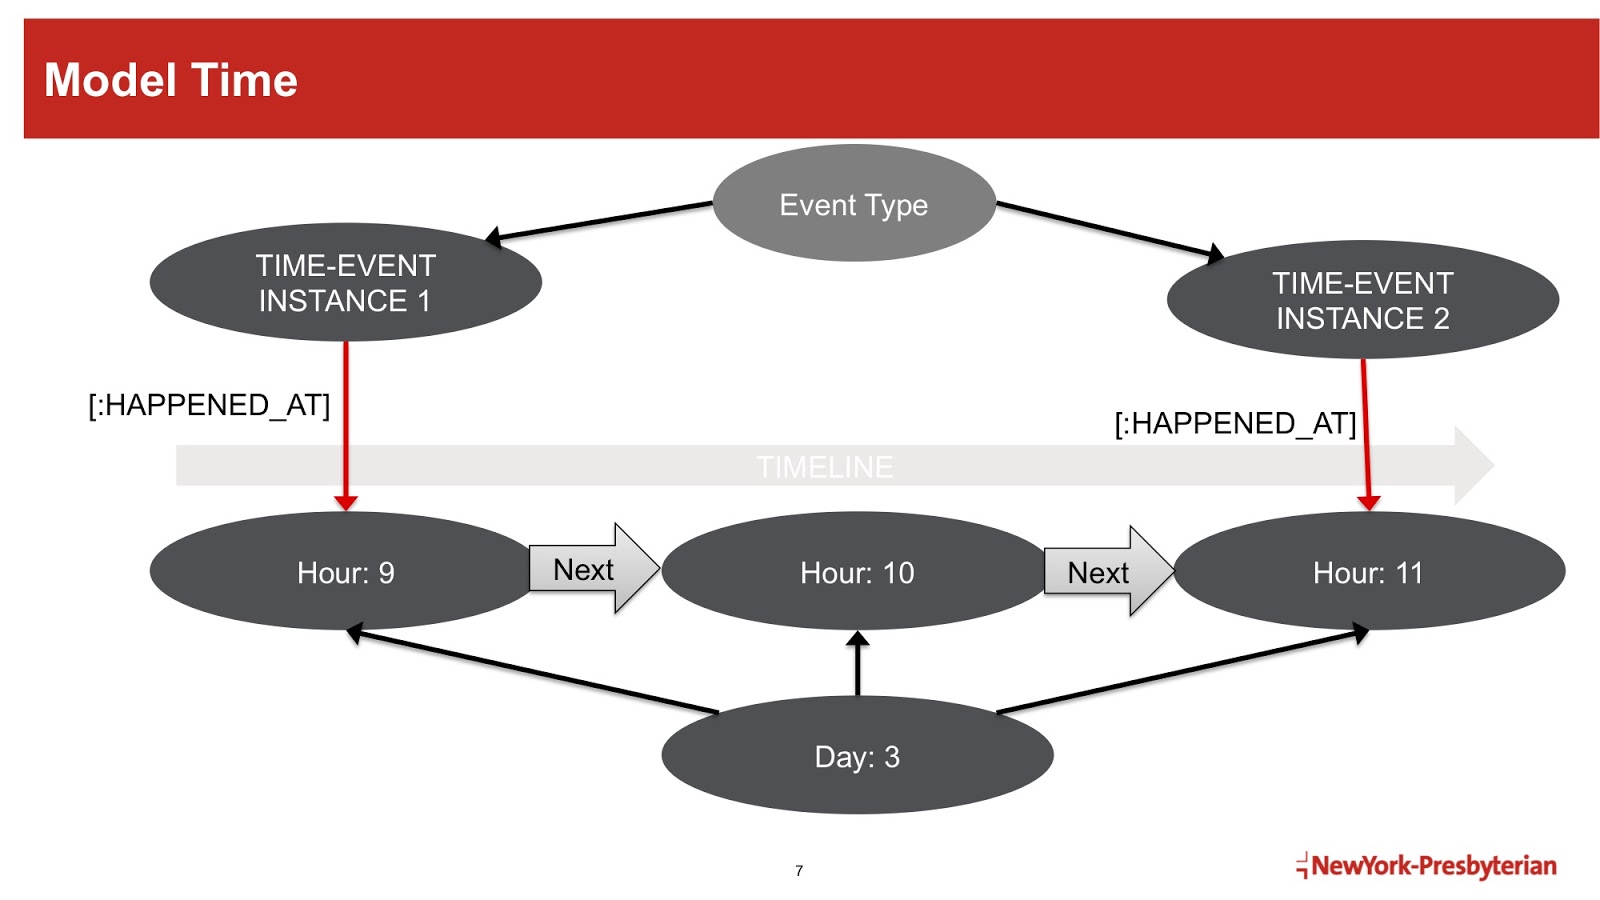
In this model, we first take a time tree. (I shamelessly stole the code from a great blog post by Mark Needham.) Essentially, we create this time tree where we have years to months to days to hours, minutes and seconds – however far down we want to go. Then, we create events with pointers to when these events happened. This is one model for capturing time series data.
Now, let’s look at a model where we have locations. These locations include hospital buildings, units and floors, which break down into rooms. Then, we can indicate in which room each instance of an event happened.

I’ll translate this into a concept that’s easier to understand. Let’s say I had a colonoscopy in the hospital. We can indicate on the graph that an instance of the colonoscopy happened in Room 9. Then later, say I had another colonoscopy in Room 11. In this way, the model allows us to graph these two instances of colonoscopies and where they happened.
Now, let’s put the time and space models together. In the graph below, we take the time tree on one side, the location tree on the other side and connect them with these “time-place-space entities.”
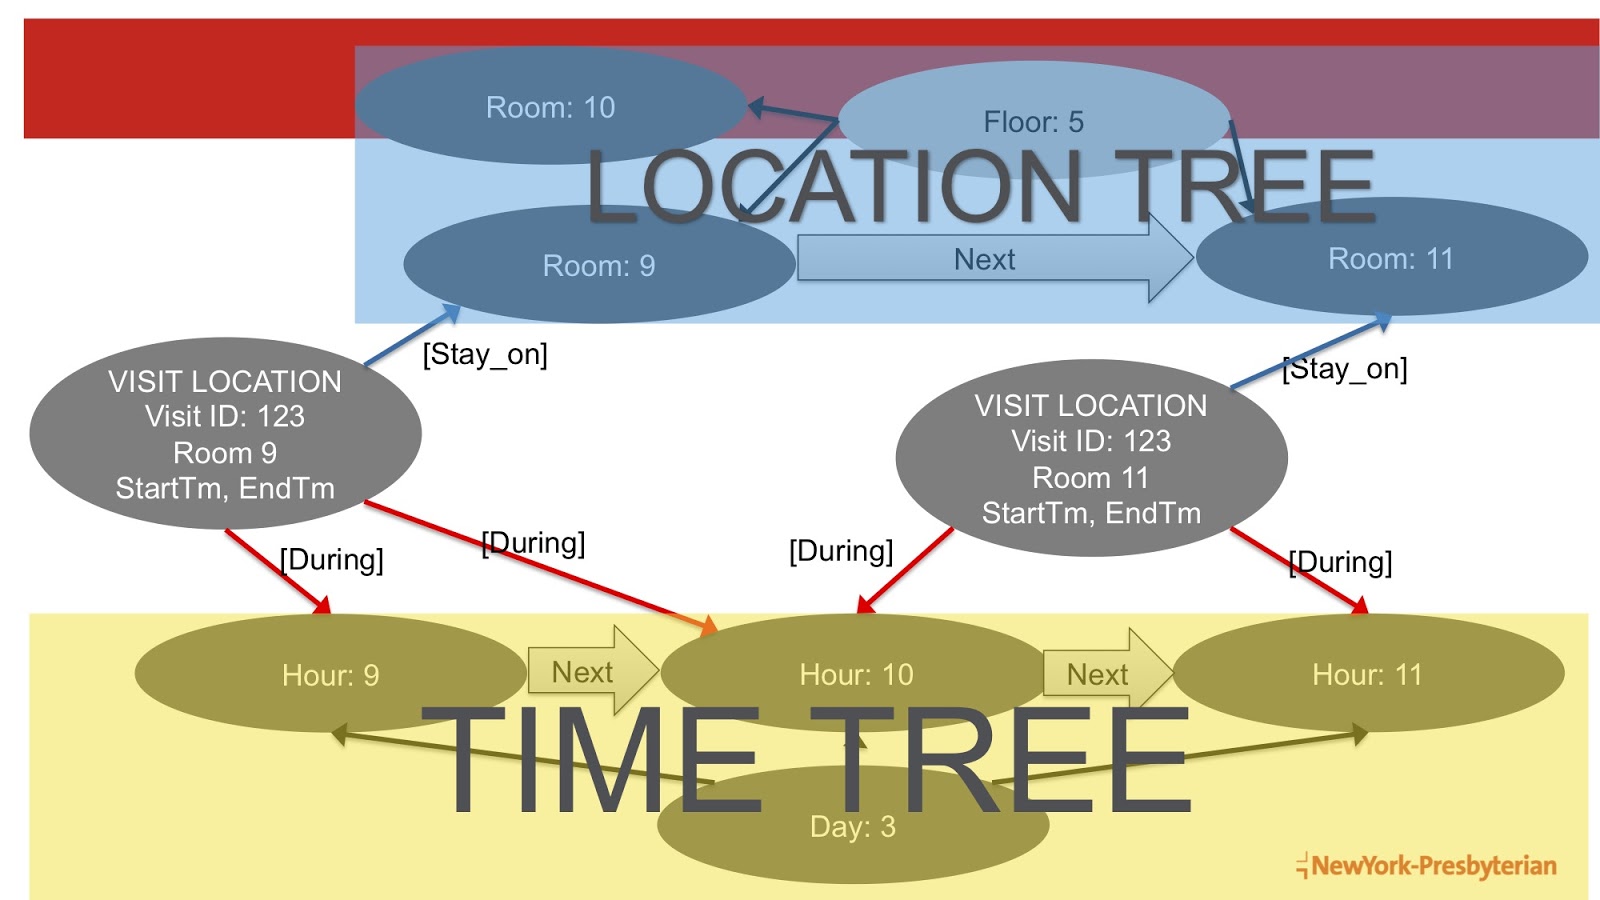
Each of the VISIT LOCATION entities represents a given visit that happened at a certain place at a certain time.
For example, we can indicate that a patient was staying in Room 9 from nine o’clock to 10 o’clock. We can also graph how sometime during the 10 o’clock hour, the patient was transferred to Room 11, where they stayed for a few hours. Essentially, we indicate when an event – or series of events – happened while the patient was staying at a certain location.
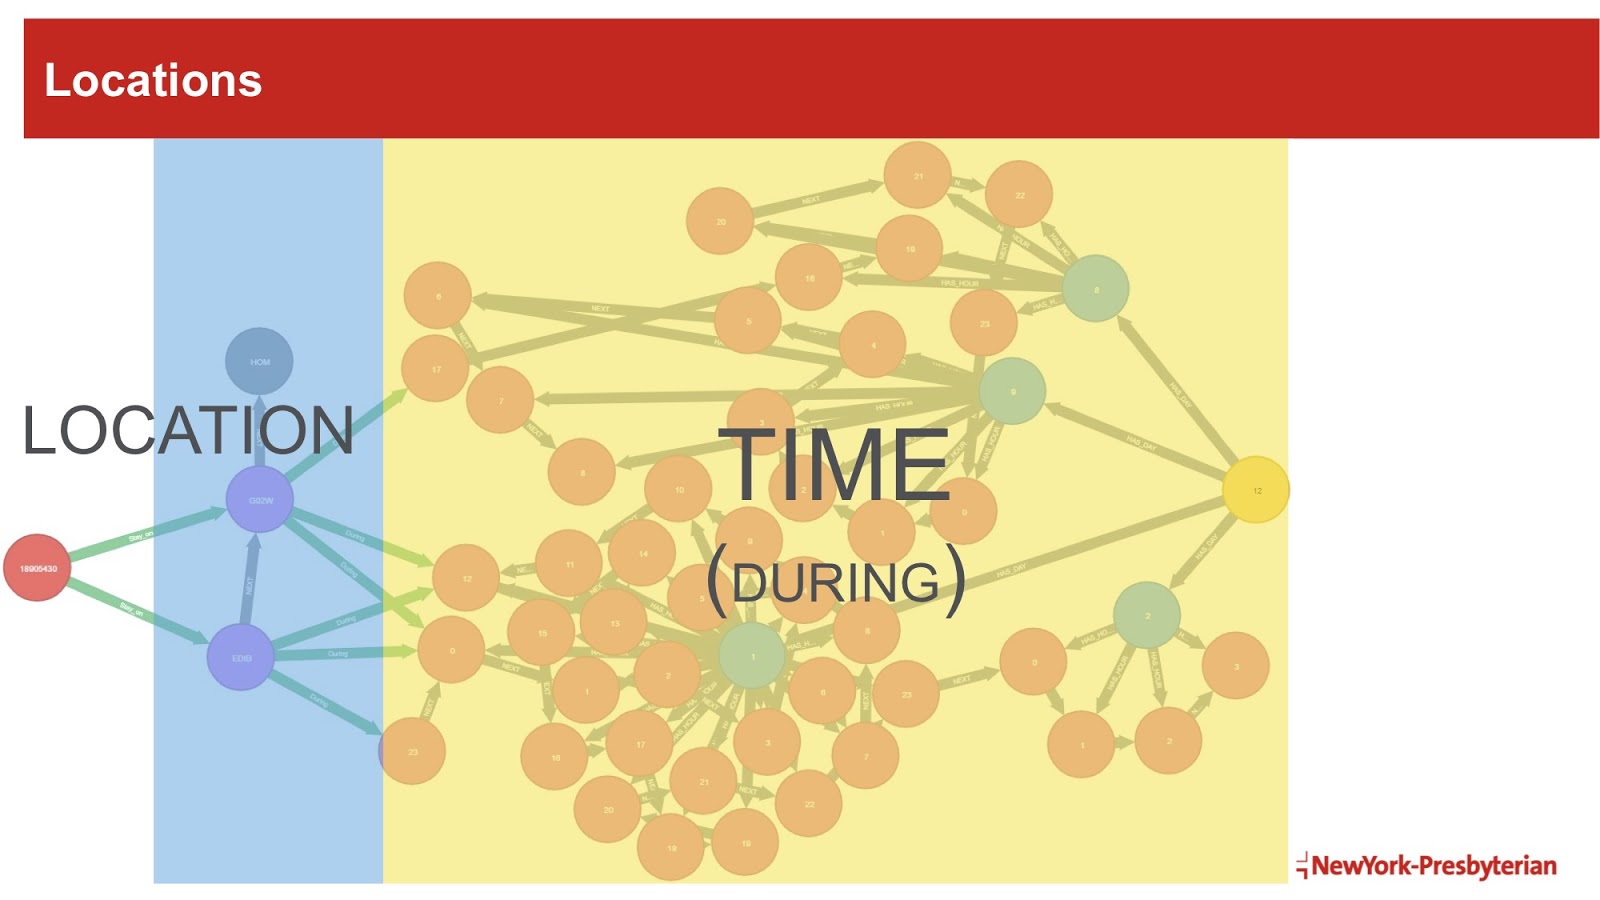
Here’s that same sort of event-time tree. In the image below, we have a visit in a series of locations over a series of time. We can now map events to these time-series nodes.
A (brief) graph analytics application
I’ll end with a cool (and somewhat unrelated) example of a graph analytics application. Now that we understand what patient flow and patient trajectory look like, we can apply a community detection algorithm to understand how patients of similar type end up in similar units, as shown in the image below.
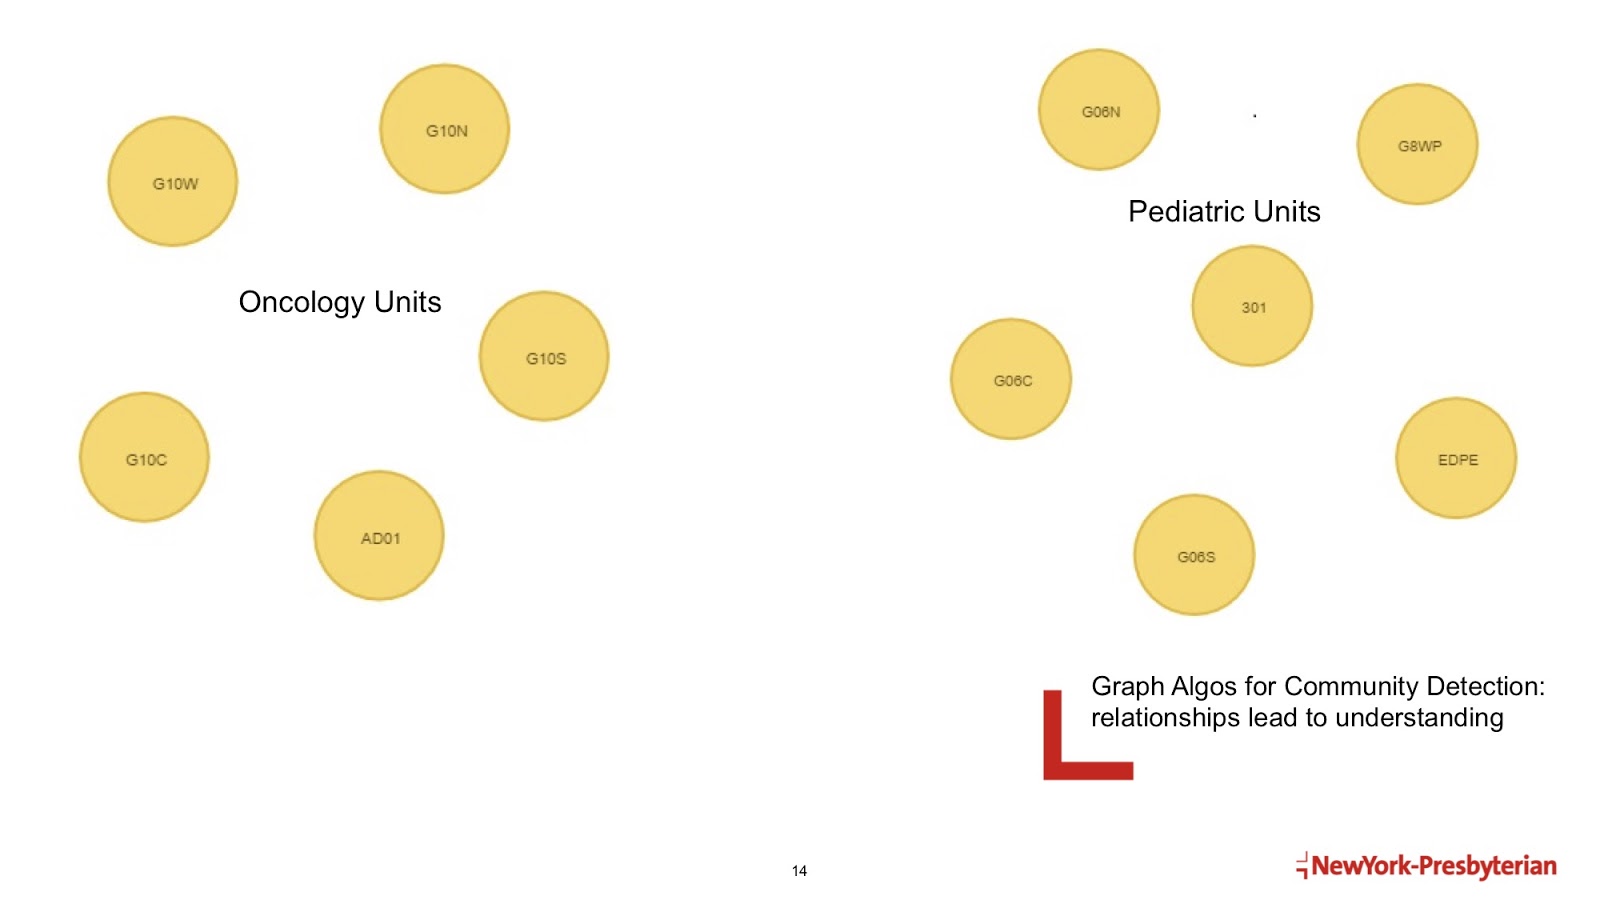
These are just some of the really cool applications we’ve been working with at NewYork-Presbyterian.
Share Article


Explore
Related Articles

Why healthcare CIOs can’t afford to scale AI without a knowledge graph foundation

How graph intelligence drives breakthroughs in science and society

Find similar patient journeys with Neo4j Aura graph analytics

What is data lineage? Tracking data through enterprise systems
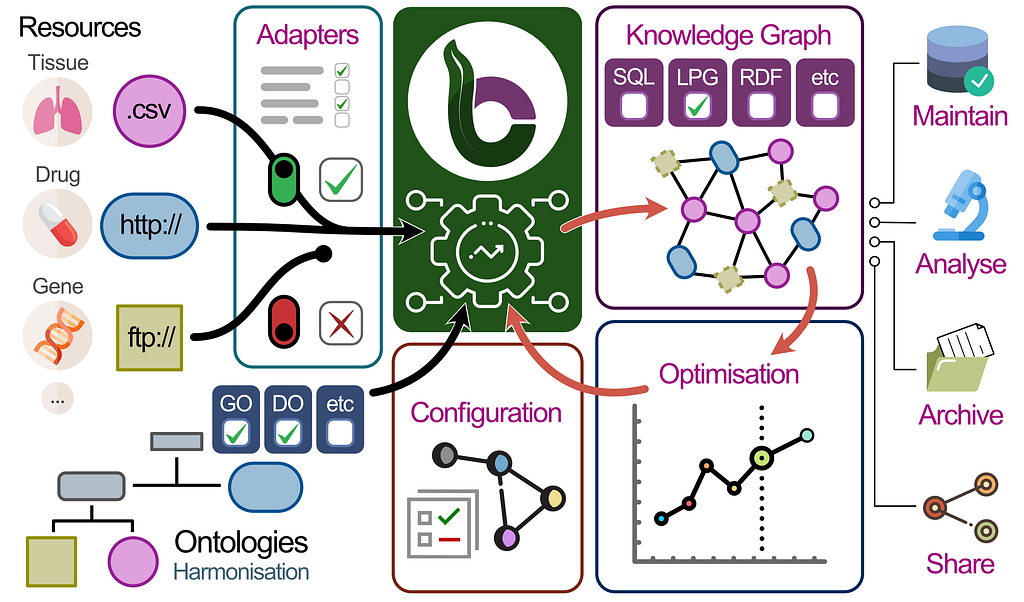
BioCypher: Unifying framework for biomedical knowledge graphs