The GraphRAG Manifesto: Adding Knowledge to GenAI

Chief Technology Officer, Neo4j
21 min read

We’re Entering the “Blue Links” Era of RAG
We are on the verge of realizing that in order to do anything significantly useful with GenAI, you can’t depend only on autoregressive LLMs to make your decisions. I know what you’re thinking: “RAG is the answer.” Or fine-tuning, or GPT-5.
Yes. Techniques like vector-based RAG and fine-tuning can help. And they are good enough for some use cases. But there’s another whole class of use cases where these techniques all bump into a ceiling. Vector-based RAG – in the same way as fine-tuning – increases the probability of a correct answer for many kinds of questions. However neither technique provides the certainty of a correct answer. Oftentimes they also lack context, color, and a connection to what you know to be true. Further, these tools don’t leave you with many clues about why they made a particular decision.
Back in 2012, Google introduced their second-generation search engine with an iconic blog post titled “Introducing the Knowledge Graph: things, not strings1.” They discovered that a huge leap in capability is possible if you use a knowledge graph to organize the things represented by the strings in all these web pages, in addition to also doing all of the string processing. We are seeing this same pattern unfold in GenAI today. Many GenAI projects are bumping up against a ceiling, where the quality of results is gated by the fact that the solutions in use are dealing in strings, not things.
Fast forward to today, AI engineers and academic researchers at the leading edge are discovering the same thing that Google did: that the secret to breaking through this ceiling is knowledge graphs. In other words, bring knowledge about things into the mix of statistically-based text techniques. This works just like any other type of RAG, except with a call to a knowledge graph in addition to a vector index. Or in other words, GraphRAG!
This post is intended to be a comprehensive and easy-to-read treatment of GraphRAG. It turns out that building a knowledge graph of your data and using it in RAG gives you several powerful advantages. There’s a robust body of research proving that it gives you better answers to most if not ALL questions you might ask an LLM using normal vector-only RAG.
That alone will be a huge driver of GraphRAG adoption. In addition to that, you get easier development thanks to data being visible when building your app. A third major advantage is that graphs can be readily understood and reasoned upon by humans as well as machines. Building with GraphRAG is therefore easier, gives you better results, and – this is a killer in many industries – is explainable and auditable! I believe GraphRAG will subsume vector-only RAG and emerge as the default RAG architecture for most use cases. This post explains why.
Wait, Graph?
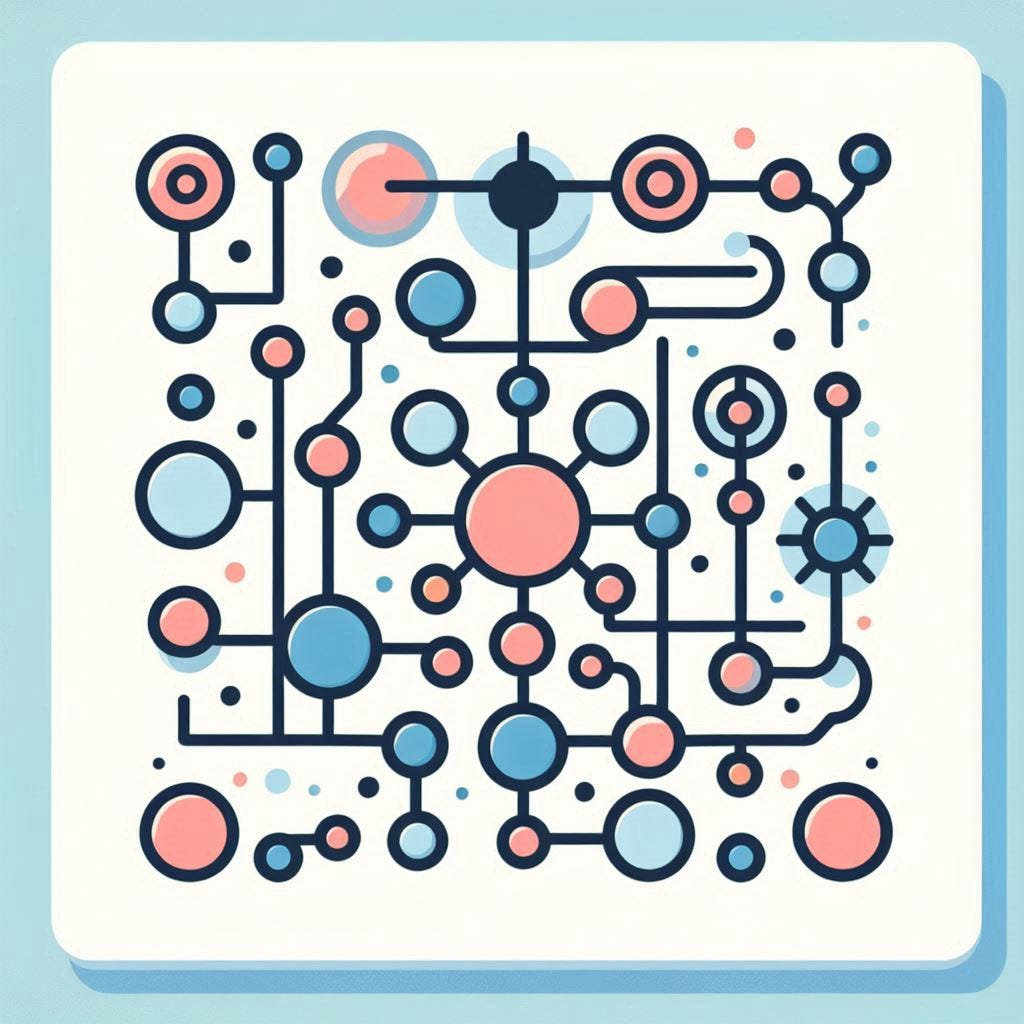
Let’s be clear that when we say graph, we mean something like this:

Or this:

Or this:

In other words, not a chart.
If you want to delve more into graphs and knowledge graphs, I’d recommend a detour to Neo4j’s GraphAcademy or Andrew Ng’s Deeplearning.ai course on Knowledge Graphs for RAG. We won’t linger on definitions here and will continue forward assuming basic working knowledge of graphs.
If you understand the pictures above, you can see how you might query the underlying knowledge graph data (stored in a graph database) as part of your RAG pipeline. This is what GraphRAG is about.
Essential GraphRAG
Unlock the full potential of RAG with knowledge graphs. Get the definitive guide from Manning, free for a limited time.

Two Types of Knowledge Representation: Vectors & Graphs
The core of typical RAG – vector search – takes in a chunk of text and returns conceptually similar text from a candidate body of written material. This is pleasantly automagical and is very useful for basic searches.
What you might not think about every time you do this is what a vector looks like, or what the similarity calculation is doing. Let’s look at an apple in human terms, vector terms, and graph terms:

The human representation is complex and multidimensional and not something we can fully capture on paper. Let’s grant some poetic license and imagine that this beautifully tempting picture represents an apple in all its perceptual & conceptual glory.
The vector representation of the apple2 is an array of numbers – a construct of the statistical realm. The magic of vectors is that they each capture the essence of their corresponding text in encoded form. In a RAG context however, they are only valuable when you need to identify how similar one handful of words is to another. Doing this is as simple as running a similarity calculation (aka vector math) and getting a match. However, if you want to make sense of what’s inside of a vector, understand what’s around it, get a handle on the things represented in your text, or understand how any of these fit into a larger context, then vectors as a representation just aren’t able to do that.
Knowledge graphs, by contrast, are declarative – or in AI terms, symbolic – representations of the world. As a result, both humans and machines can understand and reason upon knowledge graphs. This is a BIG DEAL, which we’ll revisit later. Additionally, you can query, visualize, annotate, fix, and grow knowledge graphs. A knowledge graph represents your world model3 – the part of the world that represents the domain you are working with.
GraphRAG “vs.” RAG
It’s not a competition 🙂 Vector and graph queries each add value in RAG. As pointed out by founder of LlamaIndex Jerry Liu, it’s helpful to think about GraphRAG as inclusive of vectors. This is distinct from “vector-only RAG,” which is strictly based on similarity with embeddings based on words in text.
Fundamentally, GraphRAG is RAG, where the Retrieval path includes a knowledge graph. As you can see below, the core GraphRAG pattern is straightforward. It’s basically the same architecture as RAG with vectors4 but with a knowledge graph layered into the picture.
GraphRAG Pattern

Here, you see a graph query being triggered. It can optionally include a vector similarity component. You can choose to store your graphs and vectors either separately in two distinct databases, or use a graph database like Neo4j which also supports vector search.
One of the common patterns for using GraphRAG is as follows:
- Do a vector or keyword search to find an initial set of nodes.
- Traverse the graph to bring back information about related nodes.
- Optionally, re-rank documents using a graph-based ranking algorithm such as PageRank.
Patterns vary by use case, and like everything else in AI today, GraphRAG is proving to be a rich space, with new discoveries emerging every week. We will dedicate a future blog post to the most common GraphRAG patterns we see today.
Three GraphRAG Patterns Every Developer Should Know
Transform your RAG system from vague to precise. Learn to use three retrieval patterns that bring context and relationships into your applications.
GraphRAG Lifecycle
A GenAI application that uses GraphRAG follows the same pattern as any RAG application, with an added “create graph” step at the start:

Creating a graph is analogous to chunking documents and loading them into a vector database. Advances in tooling have made graph creation literally that easy. The good news is threefold:
- Graphs are highly iterative – you can start with a “minimum viable graph” and expand from there.
- Once your data is in a knowledge graph, it becomes very easy to evolve. You can add more kinds of data, to reap the benefits of data network effects. You can also improve the quality of the data to up the value of your application results.
- This part of the stack is rapidly improving, which means graph creation will only get easier as tooling gets more sophisticated.
Adding the graph creation step to the earlier picture gives you a pipeline that looks like this:

I will dive deeper into graph creation later. For now, let’s set that aside and talk about the benefits of GraphRAG.
Why GraphRAG?
The benefits we are seeing from GraphRAG relative to vector-only RAG fall into three main buckets:
- Higher accuracy and more complete answers (runtime / production benefit)
- Once you’ve created your knowledge graph, then it’s easier to both build5 and subsequently maintain your RAG application (development time benefit)
- Better explainability, traceability6, and access controls (governance benefit)
Let’s drill into these:
#1: Higher Accuracy & More Useful Answers
The first (and most immediately tangible) benefit we see with GraphRAG is higher-quality responses. In addition to a growing number of examples we see from our customers, an increasing number of academic studies also support this. One such example is by data catalog company Data.world. At the end of 2023, they published a study that showed that GraphRAG, on average, improved accuracy of LLM responses by 3x across 43 business questions. The benchmark found evidence of a significant improvement in the accuracy of responses when backed by a knowledge graph.

More recently and perhaps better known is a series of posts by Microsoft starting in February 2024 with a research blog titled GraphRAG: Unlocking LLM discovery on narrative private data, along with an associated research paper, and software release. Here they observed that baseline RAG (i.e. with vectors) has the two following problems:
- Baseline RAG struggles to connect the dots. This happens when answering a question requires traversing disparate pieces of information through their shared attributes in order to provide new synthesized insights.
- Baseline RAG performs poorly when being asked to holistically understand summarized semantic concepts over large data collections or even singular large documents.
Microsoft found that “By using the LLM-generated knowledge graph, GraphRAG vastly improves the ‘retrieval’ portion of RAG, populating the context window with higher relevance content, resulting in better answers and capturing evidence provenance.” They also discovered that GraphRAG required between 26% and 97% fewer tokens than alternative approaches, making it not just better at providing answers, but also cheaper and more scalable7.
Digging deeper into the topic of accuracy, it’s not just whether an answer is correct that’s important; it’s also how useful the answers are. What people have been finding with GraphRAG is that not only are the answers more accurate, but they are also richer, more complete, and more useful. LinkedIn’s recent paper describing the impact of GraphRAG on their customer service application provides an excellent example of this. GraphRAG improves both correctness and richness (and therefore usefulness) for answering customer service questions, reducing median per-issue resolution time by 28.6% for their customer service team8.
A similar example comes from a GenAI workshop taught by Neo4j and with our partners at GCP, AWS, and Microsoft. The sample query below, which targets a collection of SEC filings, provides a good illustration of the kinds of answers that are possible when using vector + GraphRAG vs. those that one obtains when using vector-only RAG:

Note the difference between describing the characteristics of companies likely to be impacted by a lithium shortage, and listing specific companies that are likely to be. If you are an investor looking to rebalance your portfolio in the face of a change in the market or a company looking to rebalance its supply chain in the face of a natural disaster, having access to the latter and not just the former can be game changing. Here, both answers are accurate. The second one is clearly more useful.
Episode 23 of Going Meta by Jesus Barrasa provides another great example using a legal documents use case, starting with the lexical graph.
Those observing the X-sphere and who are active on LinkedIn will spot new examples coming out regularly from not just the lab but the field. Here, Charles Borderie at Lettria gives an example of vector-only RAG contrasted with GraphRAG, against an LLM-based text-to-graph pipeline that ingests 10,000 financial articles into a knowledge graph:

As you can see, not only did the quality of the answer improve markedly with GraphRAG vs. plain RAG, but the answer took one-third fewer tokens.
One last notable example I will include comes from Writer. They recently announced a RAG Benchmarking Report based on the RobustQA framework, comparing their GraphRAG-based approach9 to competitive best-in-class tools. GraphRAG resulted in a score of 86%, which is a significant improvement from the competition, whose scores ranged between 33% and 76%, with equivalent or better latency.

Every week I meet with customers across many industries who are experiencing similar positive effects with a wide variety of GenAI applications. Knowledge graphs are unblocking the path for GenAI by making the results more accurate and more useful.
#2: Improved Data Understanding, Faster Iteration
Knowledge graphs are intuitive both conceptually and visually. Being able to explore them often reveals new insights. An unexpected side benefit that many users are reporting is that once they’ve invested in creating their knowledge graph, they find that it helps them build and debug their GenAI applications in unexpected ways. This has partly to do with how seeing one’s data as a graph paints a living picture of the data underlying the application. The graph also gives you hooks for tracing answers back to data, and tracing that data up the causal chain.
Let’s look at an example using the lithium exposure question above. If you visualize the vectors, you will get something like this, except with far more rows and columns:

When you work with your data as a graph, you can apprehend it in a way that’s just not possible with a vector representation.
Here is an example from a recent webinar from LlamaIndex10, showing off their ability to extract the graph of vectorized chunks (the lexical graph) and LLM-extracted entities (the domain graph) and tie the two together with “MENTIONS” relationships:

(You can find similar examples with Langchain, Haystack, SpringAI, and more.)
Looking at this diagram, you can probably start to see how having a rich structure where your data resides opens up a wide range of new development and debugging possibilities. The individual pieces of data retain their value, and the structure itself stores and conveys additional meaning, which you can use to add more intelligence to your application.
It’s not just the visualization. It’s also the effect of having your data structured in a way that conveys and stores meaning. Here is the reaction of a developer from a well-known fintech a week into introducing knowledge graphs into their RAG workflow:

This developer’s reaction aligns well with the test-driven development assumption of verifying – not trusting – that answers are correct. Speaking for myself, I get the heebie-jeebies handing 100% of my autonomy over to SkyNet to make decisions that are entirely opaque! More concretely though, even AI non-doomers can appreciate the value of being able to see that a chunk or a document tied to “Apple, Inc.” should really not be mapped to “Apple Corps”. Since the data is ultimately what’s driving GenAI decisions, having facilities at hand to assess and assure correctness is all but paramount.
#3: Governance: Explainability, Security, and More
The higher the impact11 of a GenAI decision, the more you need to be able to convince the person who will ultimately be accountable if it goes wrong to trust the decision. This typically involves being able to audit each decision. It also requires a solid and repeatable track record of good decisions. But that isn’t enough. You also need to be able to explain the underlying reasoning to that person when they call a decision to the mat.
LLMs don’t offer a good way of doing this on their own. Yes, you can get references to the documents used to make the decision. But those don’t explain the decision itself – not to mention the fact that LLMs are known to make up those references! Knowledge graphs operate at an entirely different level, making the reasoning logic inside of GenAI pipelines much clearer, and the inputs a lot more explainable.
Let’s continue with one of the examples above, where Charles from Lettria loads up a knowledge graph with extracted entities from 10,000 financial articles and uses this with an LLM to carry out GraphRAG. We saw how this provides better answers. Let’s get a look at the data:

Seeing the data as a graph is the first part. The data is also navigable and queryable and can be corrected and updated as time goes on. The governance advantage is that it becomes far easier to view and audit the “world model” of the data. Using a graph makes it more likely that the responsible human who is ultimately accountable for the decision will understand it, relative to being served up the vector version of the same data. On the quality assurance side, having the data in a knowledge graph makes it a lot easier to pick out errors and surprises in the data (pleasant or otherwise), and trace them back to their source. You can also capture provenance and confidence information in the graph and use this not just in your calculation but your explanation. This just isn’t possible when you’re looking at the vector-only version of the same data, which as we discussed earlier is pretty inscrutable to the average – and even above-average!–human.
Knowledge graphs can also significantly enhance security and privacy. This tends to be less top of mind when building a prototype, but it’s a critical part of the path to production. If you’re in a regulated business such as banking or healthcare, the access any given employee has to information probably depends on that person’s role. Neither LLMs nor vector databases have a good way of limiting the scope of information to match up with the role. You can readily handle this with permissions inside a knowledge graph, where any given actor’s ability to access data is governed by the database, and exclude results that they aren’t allowed to see. Here is a mock-up of a simple security policy that you can implement in a knowledge graph with fine-grained access controls:

Knowledge Graph Creation
People often ask me what it takes to build a knowledge graph. The first step in understanding the answer is to know the two kinds of graphs most relevant to GenAI applications:
- The Domain graph is a graph representation of the world model relevant to your application. Here is a simple example:

- The Lexical graph12 is a graph of document structure. The most basic lexical graph has a node for each chunk of text:

People often expand this to include relationships between chunks and document objects (such as tables), chapters, sections, page numbers, document name/ID, collections, sources, and so on. You can also combine domain and lexical graphs like so:

Creating a lexical graph is easy and largely a matter of simple parsing and chunking strategies13. As for the domain graph, there are a few different paths depending on whether the data you’re bringing in comes from a structured source, from unstructured text, or both. Luckily, tooling for creating knowledge graphs from unstructured data sources is rapidly improving. For example, the new Neo4j Knowledge Graph Builder takes PDF documents, web pages, YouTube clips, or Wikipedia articles, and automatically creates a knowledge graph from them. It’s as easy as clicking a few buttons, and lets you visualize (and of course query) both domain and lexical graphs of your input text. It’s powerful and fun, and significantly reduces the barrier to creating a knowledge graph.
Data about customers, products, geographies, etc. probably lives somewhere in your enterprise in a structured form, and can be sourced directly from wherever it lives. Taking the most common case where it’s in a relational database, you can use standard tools14 that follow tried-and-true rules for relational-to-graph mapping.
Working with Knowledge Graphs
Once you have a knowledge graph, there is a growing abundance of frameworks for doing GraphRAG, including LlamaIndex Property Graph Index, Langchain’s Neo4j integration as well as Haystack’s and others. This space is moving fast, but we’re now at the point where programmatic methods are becoming straightforward.
The same is true on the graph construction front, with tools such as the Neo4j Importer, which has a graphical UI for mapping & importing tabular data into a graph, and Neo4j’s new v1 LLM Knowledge Graph Builder mentioned above. The picture below summarizes the steps for building a knowledge graph.

The other thing you’ll find yourself doing with knowledge graphs is mapping human-language questions to graph database queries. A new open source tool from Neo4j, NeoConverse, is designed to help with natural language querying of graphs. It’s a first solid step forward toward generalizing this15.
While it’s certainly the case that graphs require some work and learning to get started with, there is also good news in that it’s getting easier & easier as the tools improve.
Conclusion: GraphRAG is the Next Natural Step for RAG
The word-based computations and language skills inherent in LLMs and vector-based RAG offer good results. To get a consistently great result, one needs to go beyond strings and capture the world model in addition to the word model. In the same way that Google discovered that to master search, they needed to go beyond mere textual analysis and map out the underlying things underneath the strings, we are beginning to see the same pattern emerge in the world of AI. This pattern is GraphRAG.
Progress happens in S-curves: as one technology tops out, another spurs progress and leapfrogs this prior. As GenAI progresses, for uses where answer quality is essential; or where an internal, external, or regulatory stakeholder requires explainability; or where fine-grained controls over access to data for privacy and security is needed, then there’s a good chance your next GenAI application will be using a knowledge graph.

You Can Experience GraphRAG Firsthand!
If you’re ready to take the next step with GraphRAG, I invite you to try the Neo4j LLM Knowledge Graph Builder. This simple web app lets you create a knowledge graph in just a few clicks, from unstructured text sources like PDFs, web pages, and YouTube videos. It’s the perfect playground for experiencing the power of GraphRAG firsthand.
With the LLM Knowledge Graph Builder, you can:
- Connect to your free cloud-based Neo4j instance and build a graph from your favorite text sources.
- Explore your newly created knowledge graph with interactive visualizations.
- Chat with your data and put GraphRAG to the test.
- Integrate your knowledge graph into applications and unlock new insights.
To get started, spin up a free AuraDB instance and build your knowledge graph. You can learn more about the Neo4j LLM Knowledge Graph Builder and get a guided tour here!
Fix Your RAG: The Developer’s Guide to GraphRAG
Your RAG system pulls from isolated documents and misses the bigger picture. Learn how to map your data as connected entities and relationships for context-aware AI responses.
Acknowledgments
A great many people contributed to this post. I’d like to acknowledge all of you who share your learnings, writings, and code—many examples of which are cited here—and encourage you to keep doing so. It is by sharing as a community that we all learn.
I would also like to thank the many people who see the importance of GraphRAG and who generously offered their time to review and comment on the post itself. In many cases, this was informed by examples showing up in their world.
Rather than attempting to name everyone, I’d like to call out some of the people outside of what you would normally think about as the “graph world.” We are together seeing GraphRAG as not only an important trend but as a convergence between two worlds.
Having said all of this, my deepest thanks to all of you, including (alphabetically by last name):
- Harrison Chase, CEO of Langchain
- Ali Ghodsi, CEO of Databricks
- Rod Johnson, Investor and Founder of SpringSource
- Douwe Kiela, CEO of ContextualAI and Co-inventor of RAG
- Christina Li, FPV Ventures
- Jerry Liu, CEO of LlamaIndex
- Owen Robertson, Principal, DTS
- Milos Rusic, CEO of deepset / Haystack
Supplement: Further Reading
There’s been a lot written about this topic, with new insights and examples appearing every day. While I can’t hope to provide a comprehensive list, here are a few particularly good pieces you can check out if you’re interested in learning more:
- The DeepLearning.AI short course on Knowledge Graphs for RAG is a great 60-minute way to get started.
- The GraphRAG Ecosystem Tools. Start by spending a few minutes creating a knowledge graph of the data and concepts in a video from YouTube or your favorite PDF or Wikipedia page using the LLM Knowledge Graph Builder. If you don’t already have an Aura Free instance, you can create your own one here for us with the Knowledge Graph Builder.
- GraphRAG Pattern Catalog.
- Join the GraphRAG Discord.
- Tomaz Bratanic’s post called Implementing ‘From Local to Global’ GraphRAG with Neo4j and LangChain: Constructing the Graph, which integrates Microsoft’s GraphRAG work into a Neo4j + Langchain pipeline.
- Any of Tomaz Bratanic’s many other blog posts. Seriously, they’re all awesome.
- Ben Lorica’s two posts: Charting the Graphical Roadmap to Smarter AI and GraphRAG: Design Patterns, Challenges, Recommendations.
- A couple of audio references:
- The Data Exchange podcast episode, Supercharging AI with Graphs (June 27, 2024) where Ben and I both discuss the material in this post, and more.
- The July 4, 2024 ThursdAI podcast 1-year anniversary episode, which includes a dedicated segment on GraphRAG, led by Emil Eifrem.
- Deloitte’s paper titled Responsible Enterprise Decisions with Knowledge-Enriched Generative AI, with the subtitle Why is it essential for enterprise-level generative AI to incorporate knowledge graphs?
- Jesus Barrasa’s Going Meta series. It’s 27 videos and counting, each covering a different aspect or example of GraphRAG.
- Any of Leann Chen’s learning videos, including You Need Better Knowledge Graphs for Your RAG and Build an Advanced RAG Chatbot with Neo4j Knowledge Graph.
- LlamaIndex’s six-part lightning Introduction to Property Graphs.
- The GraphStuff.fm podcast, hosted by Jennifer Reif, Andreas Kollegger, Alison Cossette, Jason Koo.
- Last but not least, if you find yourself needing to justify GraphRAG to your boss and want to throw around some extra weight, look no further than Gartner’s 2024 Impact Radar for Generative AI, which puts knowledge graphs at the center of the bullseye for GenAI technologies most relevant right now!
1 Read this blog post to see just how great an analogy Google’s journey in web search is for what’s happening now in GenAI.
2 NB: These particular numbers may or may not actually represent an apple. It’s hard to know, which illustrates one of the key differences between vectors and graphs.
3 As is discussed later in the “Knowledge Graph Creation” section, another kind of knowledge graph distinct from the “domain graph” is emerging and proving to be useful. This is the “lexical graph”, which instead of a world model is a graph of the vector chunks and how they relate to one another and to the document structures around them: tables/ figures/ pages/ documents/ collections/ authors and so on.
4 Naturally this often shows up in the real world not just as a single all-encompassing step, but increasingly as a part of an agentic pipeline that follows its own set of steps and logic. This by the way is also a graph. As these get more complex one could potentially see capturing these workflows and rules in a graph database rather than in code. But we’re not there yet and it’s a different topic from the one at hand.
5 This kicks in once you already have a knowledge graph in place. This doesn’t happen for free, but you may be surprised at how accessible this is becoming with the latest advances. Because this is such a foundational topic, we’ve dedicated a section after this one on the science and art of building a knowledge graph.
6 Knowledge graphs can also help with other forms of traceability, such as capturing how data flows between systems with systems-of-systems / provenance / data lineage graphs. They can also offer other AI benefits, such as keeping track of resolved entities. Since the focus here is GraphRAG, we’ll leave all of that aside.
7 If you’re looking to dive more deeply into this and get your hands into some working code, I highly recommend my colleague Tomaz Bratanic’s post: Implementing ‘From Local to Global’ GraphRAG with Neo4j and LangChain: Constructing the Graph. This takes Microsoft’s work a step further, integrating it into a Neo4j + Langchain pipeline.
8 The paper itself includes a more detailed comparison of the GraphRAG and vector-only RAG approaches, finding that GraphRAG improved answers by 77.6% in MRR and by 0.32 in BLEU over the baseline.
9 Powered by Neo4j, as it happens.
10 Which is a great webinar showing off using their new (circa May ‘24) Property Graph Index, which includes built-in methods for converting text into a graph.
11 I think we all know what “impact” means, but just to break it down: this includes any decision where a wrong answer can have health & human safety impacts, social & fairness impacts, reputational impacts, or high dollar impacts. It obviously also includes any decision that might fall under government regulation or where there is otherwise a compliance impact.
12 Note that the term word “lexical” here refers not just to individual words, but more broadly (as the following dictionary definition suggests) “of or relating to words or the vocabulary of a language”. This encompasses everything that lies in the domain of a body of words and their relationships.
13 A few libraries that do this are, in no particular order: Docs2KG, Diffbot, GLiNER, spaCy, NuMind, NetOwl®, and (particularly for its strength in entity resolution) Senzing.
14 Stay tuned for a new version of this tool in H2 2024 that will support direct connectivity to your relational database of choice.
15 NeoConverse and the LLM GraphBUilder are both part of a growing body of GraphRAG Ecosystem Tools built by Neo4j.
Share Article


Explore
Related Articles