Driven by Graph’s extraordinary impact: Emil Eifrem on his life’s work

Vice President, APAC
15 min read
Want a dose of authentic inspiration from the man himself? Our CEO and Co-founder Emil Eifrem conceived of the first graph database on the back of a napkin on a flight to Mumbai over 20 years ago. What happened after that?
He shares the story of Neo4j’s rise and growth with Nik Vora, Vice President of APAC, and identifies some flagship moments that told him he was on the right path. Learn more about Neo4j and the extensive applications of graph technology by reading through their interview below.
Get inspired and enjoy!
In person with Emil Eifrem
Nik Vora: Hello, ni hao, namaste. This is Nik Vora, VP of APAC here at Neo4j, welcoming you to the second edition of a conversation with Emil.
Earlier last year, we had Emil talk to us about his journey with APAC, how he created the idea of graphs connecting data in a flight from Malmo to Mumbai, and how we have come so far. In New York this afternoon, we have Emil with us again. Emil, thank you so much for doing this in person. We are finally in a situation where we can travel. We can meet and the word connection has all new meanings again.
Emil Eifrem: It’s amazing.
Nik Vora: You spoke to us about why you created graphs. You spoke to us about how the journey started and your connection to Asia Pacific. Over the last 10 years, there have been so many occasions and moments where the passion for graphs and connecting data has increased and has gone global. Tell us a few stories of what drives you and what makes you do what you do.
How connected data drives investigative journalism
Emil Eifrem: That’s a good question and there’s a lot there on many levels. This is my life’s work – at least my professional life’s work – and there’s a lot of stuff that drives my peculiar interest in how components of data fit together. And it’s manifested itself in a number of different ways over the past, like you said, over the past 10 years. I’m not going to choose my favorite one – that’s like choosing your favorite children – but probably the most impactful one for us internally was going back five, six years now when the Panama Papers happened.
And I was living in Silicon Valley at the time, and I was traveling down to Disneyland with my then four-year-old daughter. And at one point, our European marketing leader called me up and said, “It’s happening. Tomorrow they’re going to release it.” And stuff like that doesn’t usually happen to me. I don’t live that exciting of a life.
And so I said, “What do you mean? What’s going on?” And she told me about, “Remember these journalists that we’re working with, the ICIJ, the International Consortium of Investigative Journalists who’ve been using our platform – they’re going to unveil this massive story tomorrow.” So we chatted a little bit about it. She didn’t know what it was, just that it would happen.
And then I went to bed. Woke up Monday morning, I’m at Disneyland, in a Disney themed hotel, and I wake up to a completely overfull voicemail inbox on my phone. I’m like, what’s going on here? And I pull up my – this is before Slack – when I pull up my inbox it’s just overflowing.
And so what had happened was that the ICIJ had an international global press conference talking about the Panama Papers, which is this massive leak of information from a law firm in the Panamas – so that’s why it’s called the Panama Papers – who specialized in offshore tax accounts. Those can be used for legal tax planning, but as it turns out was and maybe still is frequently used for illegal tax evasion.
And they had gotten this huge data dump of terabytes after terabytes of information. And we live in a world now where terabytes may not sound like a lot, but that’s when we talk about machine generated data, that’s when you can reach petabytes. These are terabytes of forms, physical forms that were scanned – passports, tax declarations, emails, things like that. That’s a massive, massive leak.
And so the ICIJ looked at that leak they got from that law firm and they realized that there’s no way they could make sense of this. Just think about that. What would you do if you have terabytes of scans of docs – how would you go from that into a story as a journalist, right?
And the realization that they had was, “You know what? Investigative journalism – it’s a lot about finding indirect connections.” There’s an expression in English called “hidden in plain sight.” I don’t think that one is true for investigative journalism. If it’s there in plain sight, someone would have written about it.
Nik Vora: Yeah.
How the Panama Papers Shaped Emil’s Vision
Emil Eifrem: But for this kind of stuff, if you are a politician, you’re not going to be directly connected to a bank account in some offshore tax haven, but you will be indirectly connected through someone you know, who’s an officer in a company with a shell company that owns a subsidiary who then has an account in an offshore tax haven – so multiple hops away.
And this team had the foresight to understand that “Hey, this is actually about connections and multiple hops out.” And so they extracted that data, the terabytes of data through OCR technology and things like that and then they ended up putting it ultimately into Neo4j. And because they put it in a format that allowed them to see multiple hops out, they could just visually look at the data and realize that, you know, over here is Sigmundur Gunnlaugsson, who’s the now-former Prime Minister of Iceland and he lived at an address.
At that address, someone else lived. That person was an officer in a company. That company had an offshore tax haven. You can just hear how many hops – that’s six, seven hops out, right? Put that in Excel or a tabular format and it doesn’t matter how much you scroll down and what you do with it – you just won’t be able to find it.
Nik Vora: Yeah.
Emil Eifrem: Right. You put that in a graph and that pattern emerges out to you. And so that was this big, massive story, which became the biggest news story of all of 2016. And it ultimately ended up winning the Pulitzer Prize for it. Several big politicians and business leaders ended up being indicted over this. And we collected billions of dollars of tax revenue that was previously hidden.
So that’s an example of just the power of connected data that candidly has nothing to do with making money for us – and we’re not against making money or anything like that – but ultimately that level of impact we’re having is exceptionally inspiring for me.
Nik Vora: That is so great to hear. Growing up we often hear there’s many ways to make money. The best way to make money is where you find your purpose.
Emil Eifrem: Right.
Nik Vora: And in this day and age, when there’s so much around us that’s happening globally – that we don’t feel okay with, that we don’t feel is right, or the right world to leave behind for our kids – I think it’s important to associate ourselves with a technology or a daily life that has purpose and is helping at some level, right? Everyone has commercial needs, but what are you doing beyond that? And I think in the story about connected data’s impact, I think the impact of connected data was the hero. It was not an overnight success. There was a lot of work, and so many years were put in, but this was the moment on stage where this came about.
This is not a use case you can think about, right? You’re always focused on developers. You’re always focused on community. You are always focused on enabling everyone everywhere who has an intent, who has a purpose, who wants to do good and has a laptop. Talk to us about some of the initiatives or stories that you remember over the years with students, with universities, with community members, that stand out for you.
The genesis of Graphs4Good
Emil Eifrem: Yeah. Just to connect what you said about the previous story around the Panama Papers – that’s exactly how it happened. We didn’t sit down and think, “You know what? Journalists, we should go out to all the investigative journalists in the world and say, “Hey, here’s a graph database!” That’s not at all how it happened.
They found us, they realized that, “What if I look at the world in networks – that’s actually what investigative journalism is about. And what if I could look at data – as investigative journalism’s moving to becoming more of a data journalism play – what data should we look for?” Well, it’s about patterns and connections in data. And through that, they found us. And so it is very, very much a process driven by them, where our job was making it horizontally available to everyone.
Now, since then though, after that, inspired by that, we put together a program under the Graphs4Good umbrella, which we love and were investing a lot in. We were focused specifically around investigative journalists, where we were proactive and went to The Guardian, to the BBC, to The New York Times, The Washington Post, like all these massive media organizations and we trained them and said, “Hey, based on the Panama Papers’ success, you know what? You should consider using graphs for your investigative work.”
So since then we’ve done a lot of proactive work to engage people. But the fundamental way that we make this happen is by going out and making it horizontally available to everyone – developers, data scientists, data journalists.
Nik Vora: And in recent years, as we have seen more applications of connecting data, of graphs, not only on the core database application development, but also on data science – what are some of the impacts of graph data science that have stayed with you?
The rise of graph data science
Emil Eifrem: Yeah, there’s a lot there too. Maybe let me zoom out at first to collect my thoughts on the general applicability for graph for data science. And then I’ll go to one or two favorite use cases.
So the broader view here is that if you look back to all machine learning up until maybe five years ago it was all focused on basically tabular data. In data science and machine learning, you don’t talk about it that way. You talk about tensors, you talk about vectors and things like that, but it’s basically rows of data that you look at and you compute and analyze when you train your models.
And that’s great, that’s very powerful, but it ignores how things fit together. So if you’re a big insurance company, for example, and you’re wanting to look for insurance fraud, you’re going to be able to look at first name, last name, age – whatever is filled out on your insurance claims and things like that. You will miss that this person lived at an address. At some other point in time, another person lived at that one address. If they participate in the same claim in some way, it may be fraudulent behavior. Your entire machine learning pipeline will just drop those connections on the floor.
Which means that the way I think about it is that they see in 2D or they see in black and white and through Neo4j and graph data science, they’re able to see the relationships that tie things together, which then moves them from 2D to 3D, or from black and white to seeing in color. It doesn’t mean that it was bad to see in black and white – that’s still very valuable. It’s just another dimension and that allows them to do much better predictions, which is ultimately what data science is about.
And as I think back on the last few years – you kind of started out by framing it as an uncertain world we live in, which we certainly have seen the last several years with the pandemic, the geopolitical stuff more recently, and things like that. If I look at the previous crisis of the pandemic, I don’t think I can speak about specific names, but one of the big vaccine manufacturers is using Neo4j to optimize both the supply chain, because it turned out that once the vaccine was invented, it then ended up becoming a supply chain issue – that is what it was, right? If you think about what a supply chain is, it’s a graph, it’s a network, you can even hear it in the name “supply chain,” right?
So they use Neo4j to optimize that supply chain, but also to optimize internally in the manufacturing plants – like how is information and physical goods flowing inside of the plants to create the most optimized manufacturing process for the vaccine? So it’s very likely that thanks to Neo4j, the COVID-19 vaccine was accelerated by weeks, if not months. And that I think is amazingly inspiring.
Neo4j and graph’s global footprint
Nik Vora: That is very, very powerful. When I was joining the team here at Neo4j, one of the things that resonated with me the most was a lot of people work in technology and when COVID hit all of us, it was difficult to see how we are making an impact. COVID put so many things in perspective. You know, how many materialistic desires do we really need? What is it that really matters to you? And it came back to doing work that was meaningful. It came back to doing work that really resonated with you, with the future generation, something you can be proud of.
And a small plug here: the use cases, the impact we have not just on our customers, but also on organizations, on journalism, on creating an open transparent world, is deeply personal. And we are aggressively expanding across the global footprint. So all of you who believe in connected data, who believe in graphs, come join the team. Across Asia Pacific, we have many, many headcounts across different functions. And we are always looking for the best players to come and further this mission along.
Emil, final question: what keeps you going every day? You work tremendously, you lead a rockstar organization, but what keeps you going every single day?
Emil Eifrem: Multiple things. Working with the people that we have here is amazing and very rewarding. I think fundamentally though, the entire framing of this conversation was around the impact. But ultimately that is the key driver for me. Like we haven’t even touched on NASA being publicly on the record saying that thanks to Neo4j, humanity is going to get to Mars two years earlier. That’s a pretty extraordinary thing.
And just to make it a little bit personal – a half brother of mine is probably the easiest way to explain it – died of cancer when he was 24 years old. He’s my American brother. And so that was 20 years ago or something like that right. Today, I personally know over 20 projects that used Neo4j to find the cure for cancer. And I think if on some level, if all I achieved professionally – like kind of the tombstone test – was increase the probability of finding the cure for cancer by 1 percent, if that’s all I have achieved, I would rest in peace. I would feel very, very satisfied and happy with that. And I think the opportunity we have here at Neo4j is massively bigger than that.
Nik Vora: That is so well said, Emil. We often get caught up in this race to say, what is the next tagline I’m going to put on my LinkedIn, but instead of the LinkedIn test, if you do the retirement test and say –
Emil Eifrem: Yeah, that sounds better than the tombstone test. I like that.
Nik Vora: At retirement, what is it that you want to leave with, right? Is it working in every technology company, working with customers? That’s all great and that’s part of our job here, but making that impact, creating that impact – that’s so personal.
We would love to have you over in Asia Pacific and do this with all of our developer friends and customers and partners in person again. But thank you for taking time out this afternoon here in New York, and to all developers and all of our friends who are listening, Neo4j has Aura on cloud where you can sign up for no cost and certify yourself.
We constantly think about how we can make an impact. If you want to make an impact, if you know how to code, here’s your chance. Supply chain disruptions, journalism, open transparent world – we can all together make a big difference. Thank you for your time, Emil.
Share Article


Explore
Related Articles

SumoDB in Neo4j: Chaining Multiple Graph Algorithms in Snowflake — Part 3


Why machines need embeddings: Turning graph structure into features
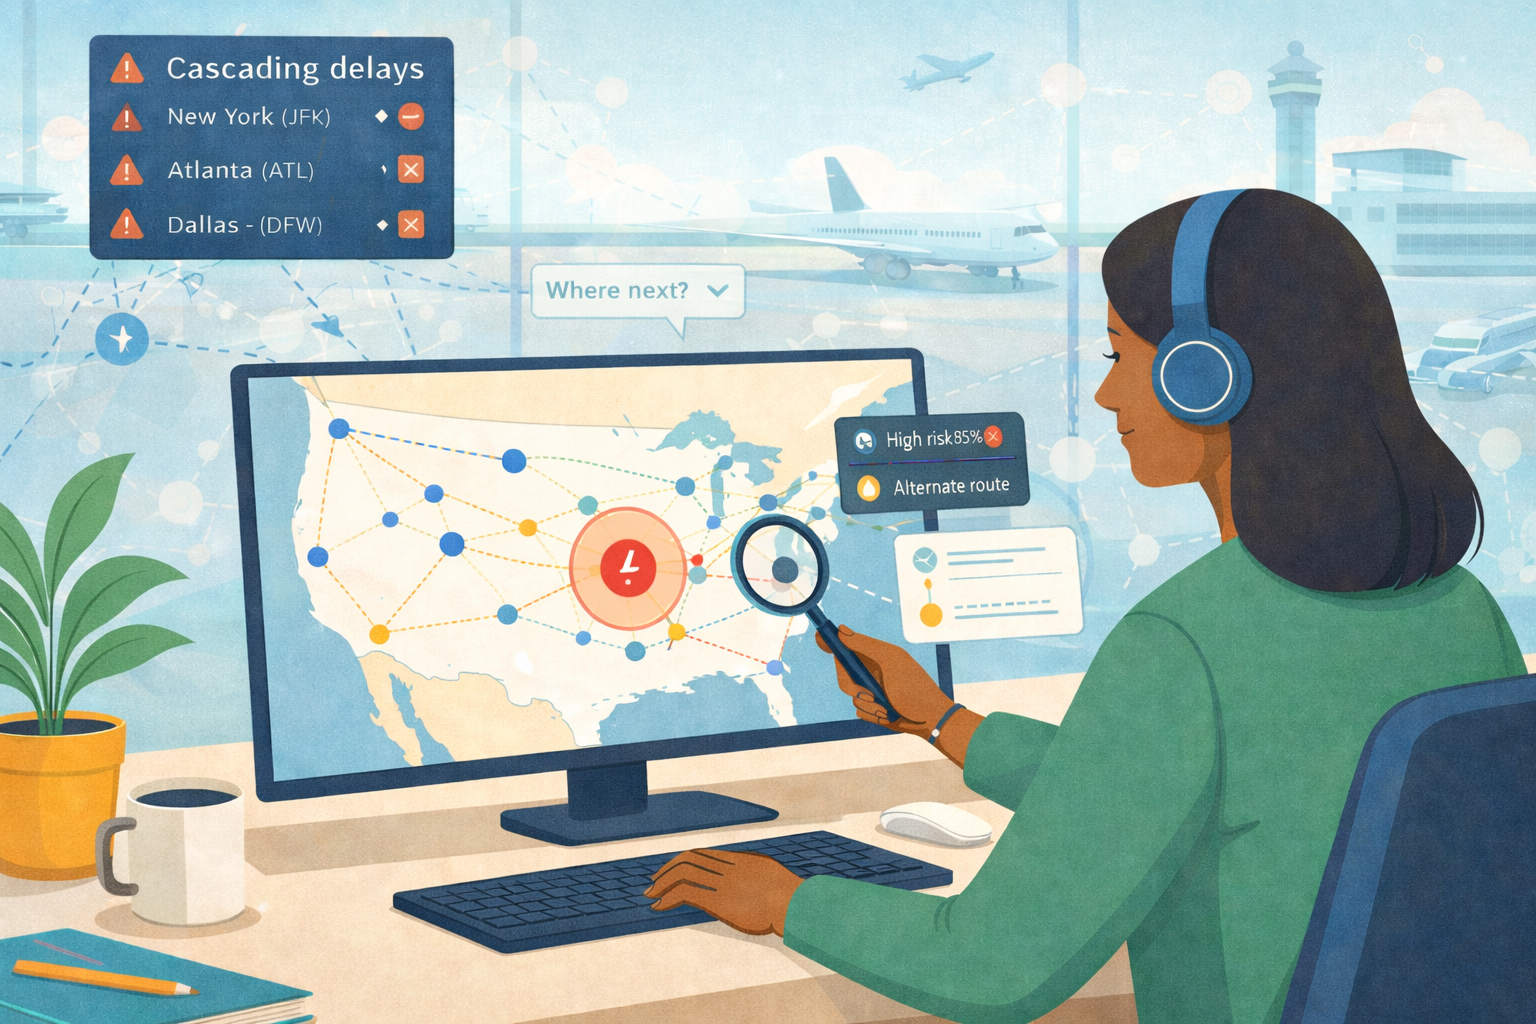
Finding hidden bottlenecks in flight networks with Aura graph analytics on Databricks