Graphs for AI and machine learning

Chief Scientist, Neo4j
9 min read
Editor’s Note: This presentation was given by Dr. Jim Webber at GraphTour Boston in 2019.
Full presentation
If there’s any area of computer science that’s prone to nonsense today, it’s artificial intelligence. I’m going to walk you through some no-nonsense definitions of AI-cronyms, share my history with graphs and intelligent applications, and take a little peek into the future of graphs for machine learning and AI.
A bluffer’s guide to AI-cronyms
Artificial intelligence (AI) is the property of a system that appears intelligent to its users. Machine learning (ML) is a branch of artificial intelligence that analyzes historical data to guide future interactions, specifically within a given domain. Overall, achieving AI is an interesting process, whether we’re using a fancy machine learning framework to do it or not.
If you’re quite high up the AI evolution chain, you may be able to implement ML that allows you to cheaply retrain models across neighboring domains. This is often conflated with plain old predictive analysis – using the past to predict the future – and General-Purpose AI (GPAI) – applying learned experiences in one domain to another. For example, you know that hitting your head on a wall hurts, so you learn not to hit it on the desk either.
Traditionally, we take tabular data, columnar data, or even document data, and we extract features from them directly. It’s not a bad machine learning pipeline; you get some value from it, it helps drive your business, and it brings something useful to your domain.
But we can do a lot more with graphs before we reach for the ML pipeline. Think of the ML pipeline as the icing on the very top of a cake.
What is a graph?
For clarity, the one on the left is a graph. The ones on the right are charts, not graphs.

The first skill that we learn in graphs is this notion of triadic closure, which basically means “make a triangle.”
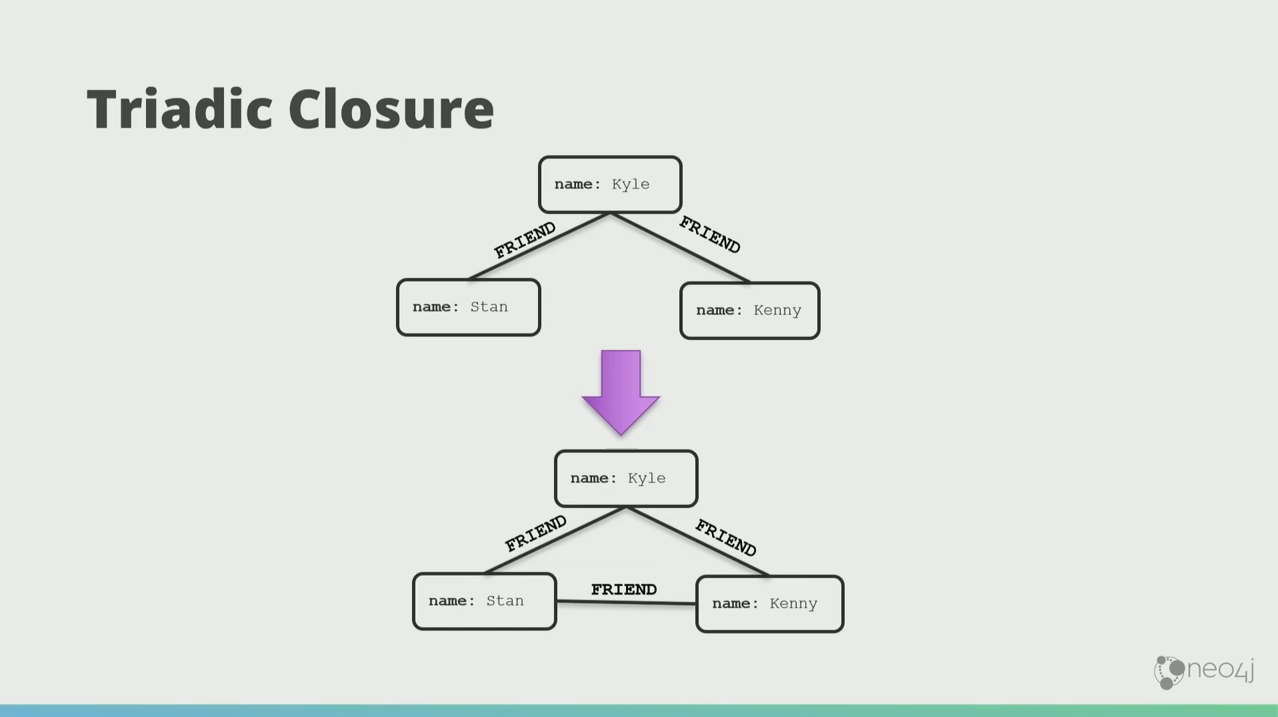
Kyle have two friends, Stan and Kenny, and those two friends over time will become friends with each other too.
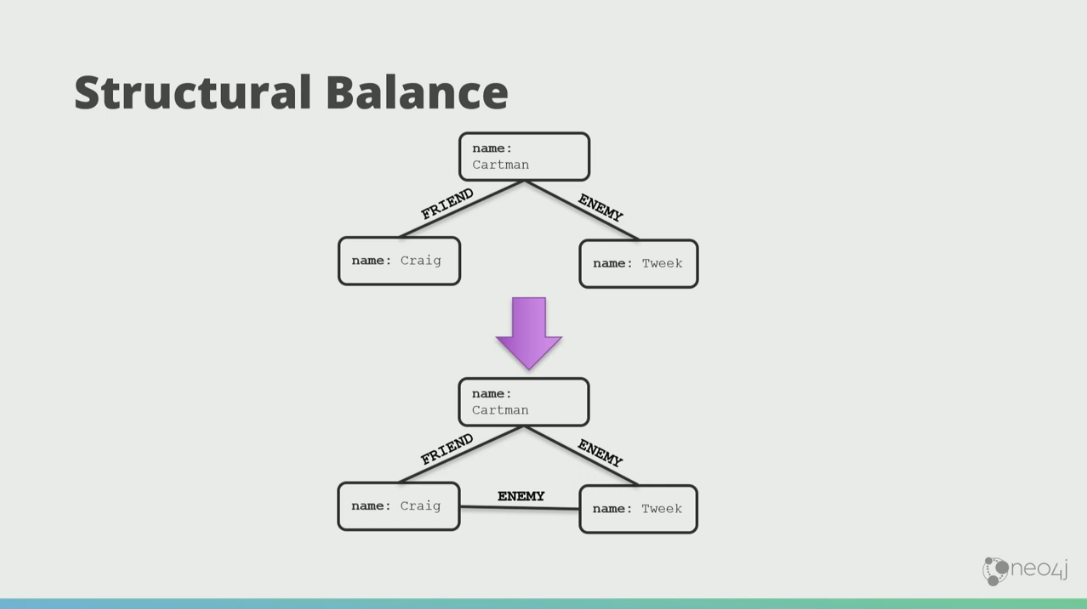
There’s also this notion of structural balance. If Cartman has a friend, Craig, and an enemy, Tweek, then chances are over time Craig and Cartman will both hate Tweek.
The triadic closures can also have strength.
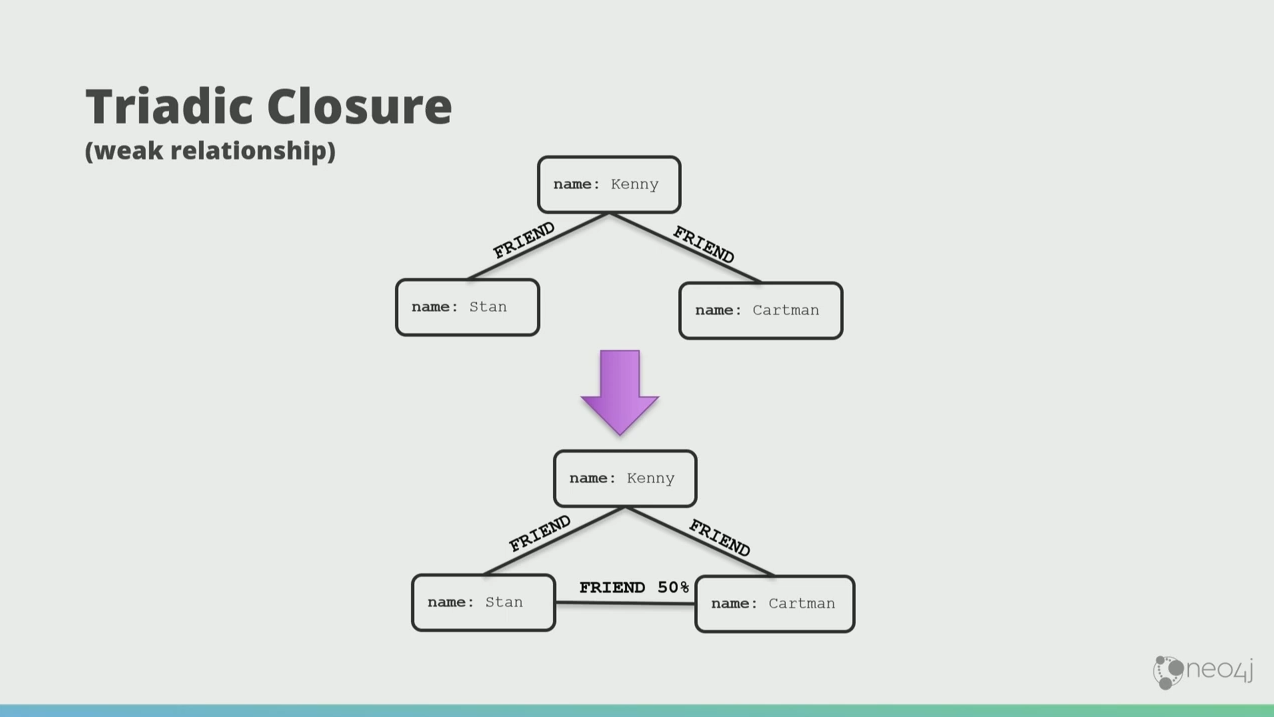
Weak relationships play a profound part in understanding graphs because they separate neighborhoods.

In this case, Stan and Wendy are only half friends, they don’t really like each other. But these weak relationships form bridges, and if anything wants to go between those communities, it goes via Stan and Wendy. You can also think of the graph as an org chat, and the weak relationships as where information flows from a team to another.
My history with graphs
I’m a big Doctor Who fan. Let me tell you how I’m connected to Doctor Who.
I wrote the O’Reilly book Graph Databases with my mate, Ian Robinson, who’s also a big Doctor Who fan. This means I’m an author, and he’s also an author. Ian was also a landlord, who owned a flat in Birmingham, my hometown. He sublet that flat to an actor, Chris Adison, who played a character Ollie in a TV series called The Thick of It. In that series, there’s a character called Malcolm Tucker, who is the Shakespeare of swearing. The actor Peter Capaldi who played Tucker also played a regeneration of Doctor Who. So if I follow all of those things around, that’s how I’m connected to Doctor Who.

This is super cheap to process in a graph database. If we want a smart system, we can take a step back. We don’t have to immediately try to gain insight or build systems that appear intelligent. We can do more with our data before then.
If we’re building a product recommendation, the me from 2008 would have paid $10 million to some relational database company because databases have tables, right? What you would get is something like Amazon’s recommendations. If I bought a pair of shoes off Amazon, it would continue to recommend me more shoes like I’m an octopus. But as a biped and middle-aged white guy, I buy shoes about once every five years.
Look at it as a graph problem instead. If someone bought something, you could see other products that depend on it, and you would also see a way to not make conflicting recommendations while looking at the dependency graph.
That’s what I built at the North American telecom company I worked for in 2008. I thought I’d invented Skynet, because I built a system that appeared to be intelligent to me as a user. I was genuinely flabbergasted. Buy me a beer later if you want to know how delivering that incredible business result got me fired.
How graph search works
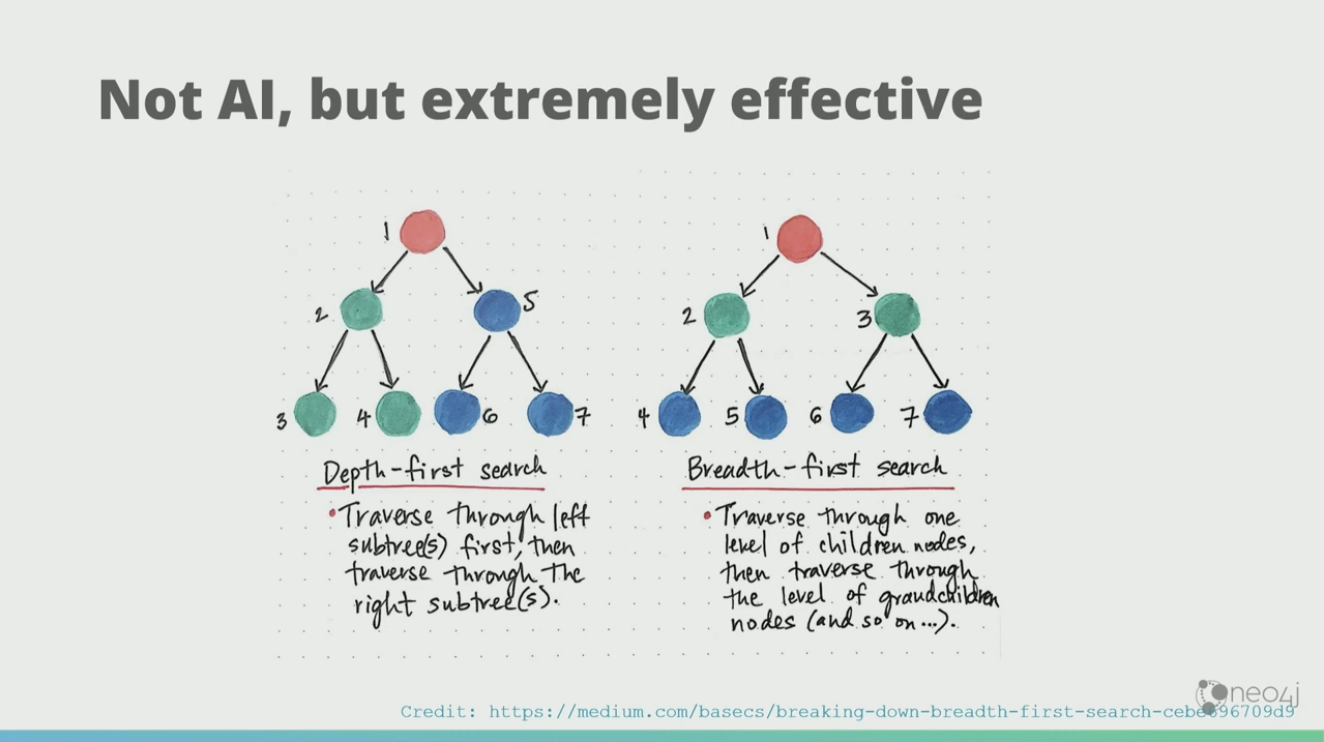
Then, the rational part in my brain reasserted itself, “Jimmy… that wasn’t AI. That was a graph search. That was the thing you forgot from Algorithms 101.” Thanks, patronizing part of my brain. But with data structures and algorithms, we could build systems that appear to be intelligent. It wasn’t AI, but it was extremely effective. In one afternoon, we solved the problem that we thought would take us three years to solve.
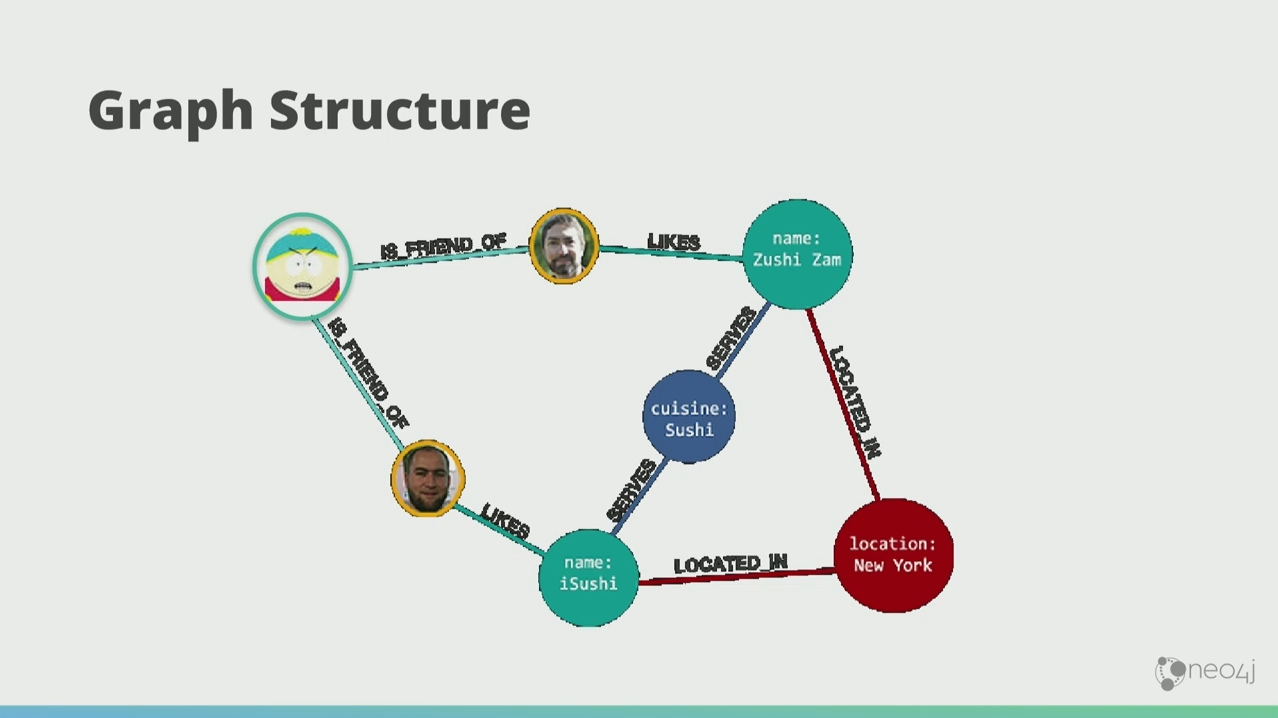
A graph search works like the search on Facebook. I want to know which are the sushi restaurants in New York City that my friends like. Michael likes iSushi. Andreas like Sushi Zam. They’re both in New York and both serves sushi cuisine.
You’ll only need the simplest query to get intelligent results in a graph search.
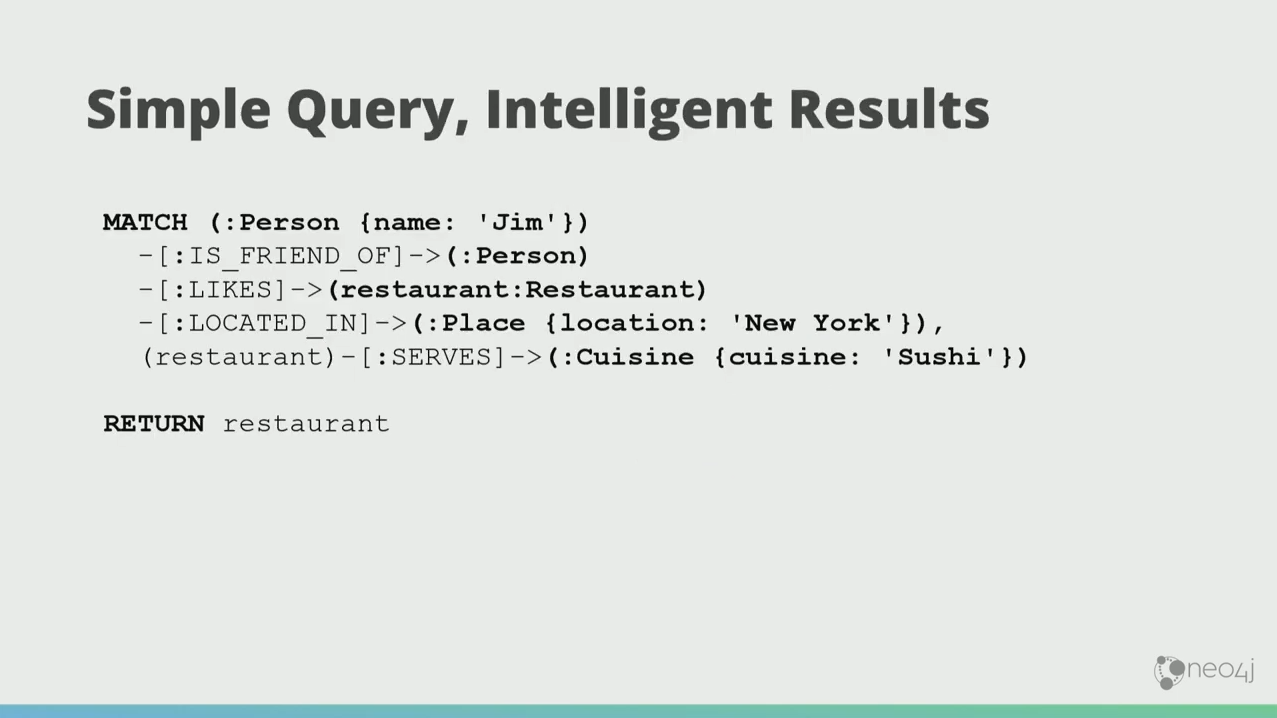
Even though the dataset might be huge, it comes back very quickly because in the graph world, the latency of your query is proportional to how much of the graph you want to traverse, not how much data you’ve stored. Neo4j, particularly, is quick enough to do 40 million traversals in a second.

Supermarket
I was back in the UK some years later, and we started looking at purchasing behavior for a large supermarket. We were enamored of this phone call from the U.S., when we found out that if they put beer and diapers together, they sell more of both. That was a hook for us.
We took a bunch of transactional data and a bunch of taxonomical data.
And we stuck them into a graph.

What we observed from our purchasing data was this young fathers pattern.
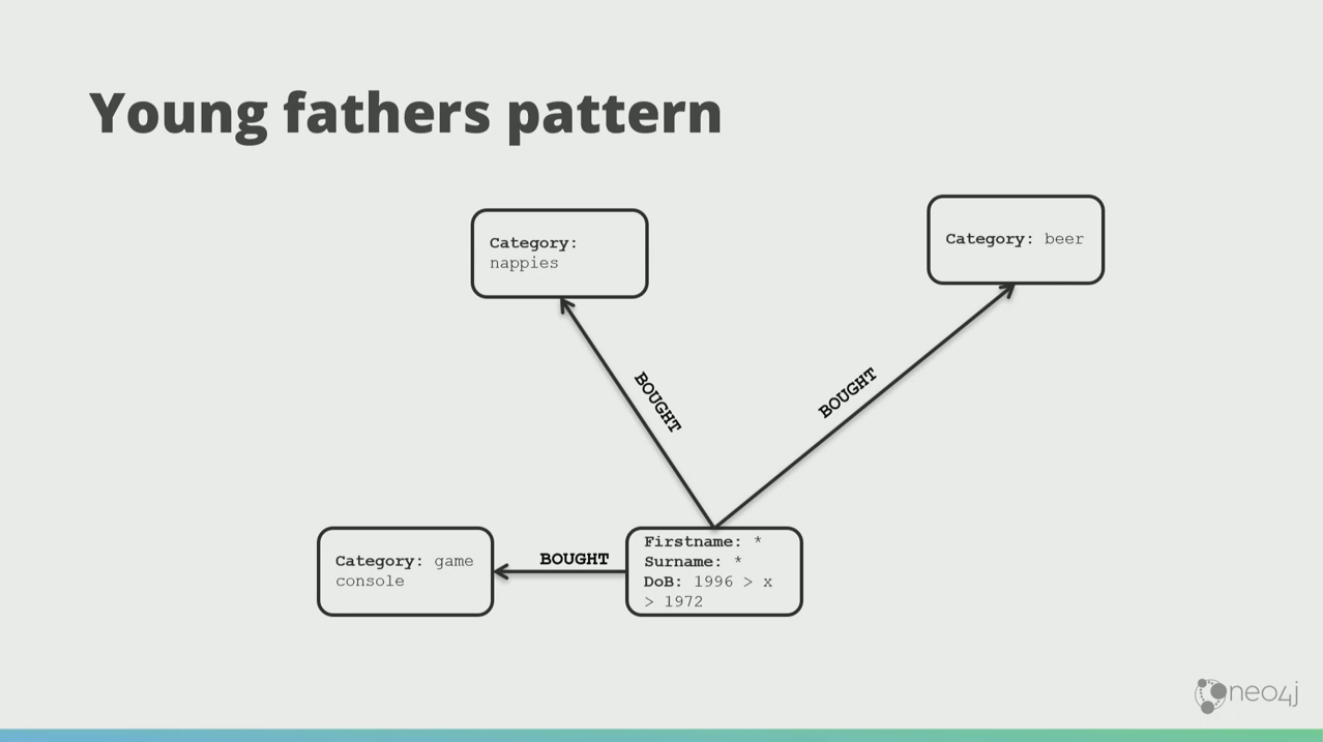
So, if you spot someone that’s bought beer and nappies, but hasn’t bought a game console, you can sell them a game console.
Now if you had chosen to run this through a machine learning framework directly, the machine learning might decide that the father drinks beer and wears diaper, which is not what we really want.
World War 1
World War 1 was one of the worst periods in history.

In this graph, the red arrows indicate enemies, and the black arrows indicate alliance.
Austria, Germany, and Russia were in the League of Three Emperors. Now, Italy wants in on this. So it forms a structurally balanced closure with Austria and Germany.
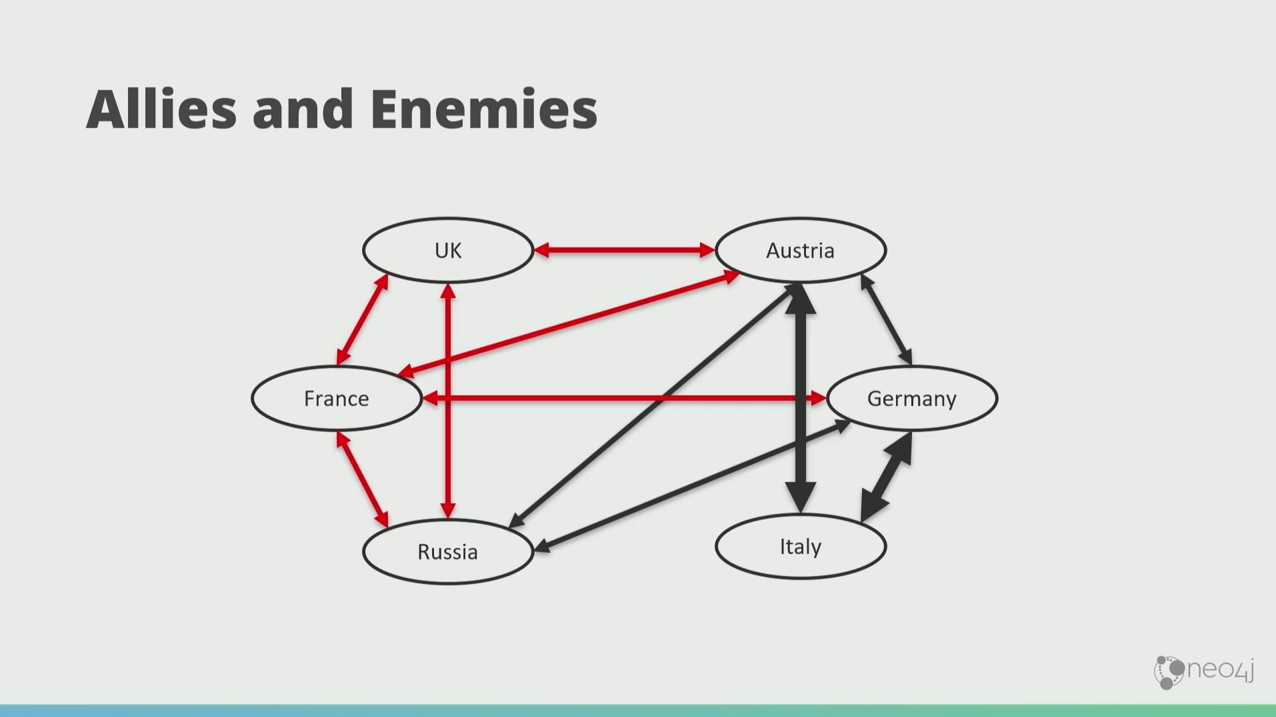
And then the Germans and the Russians fell out, and there’s a three-way enemyship there.
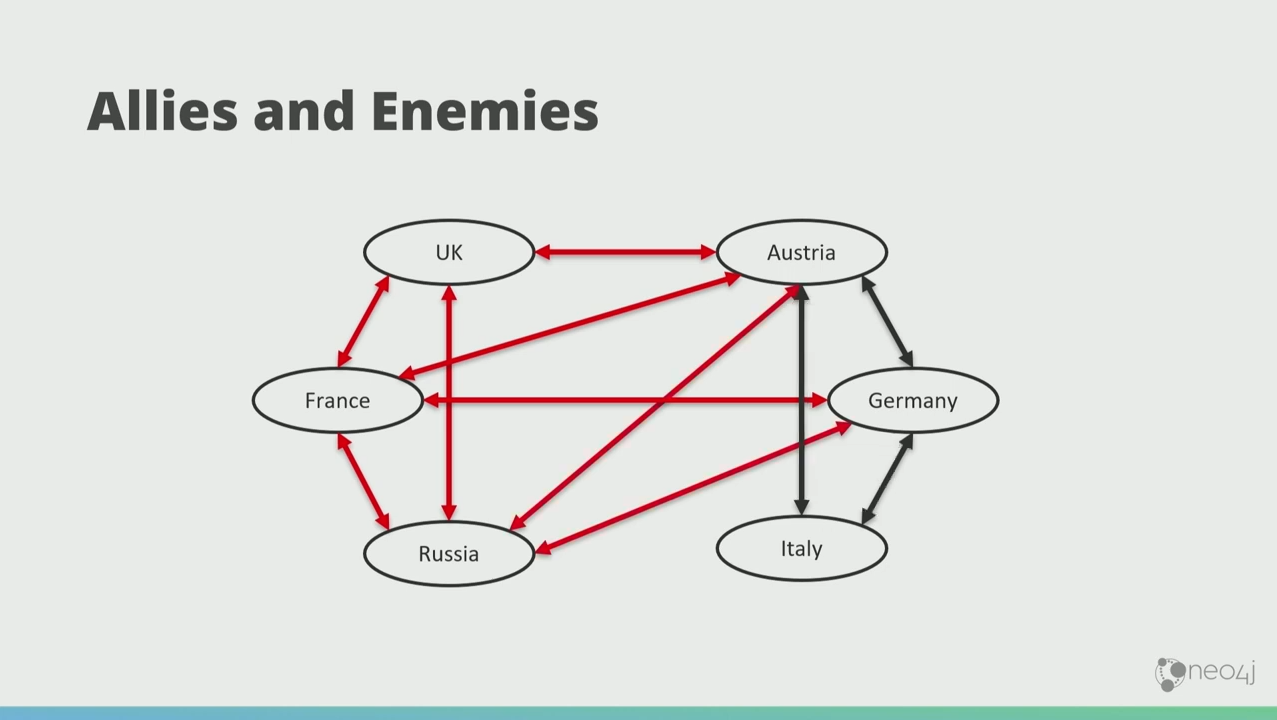
That doesn’t feel stable. The graph doesn’t like that. It wants to make these things stable. So what happens is France and Russia naturally gang up so that if necessary they can take on Germany.

Then the weirdest thing in history happened. The French and the Brits became friends. Now that’s weird because now Russia, UK, and France are in this unstable, awkward demographic.
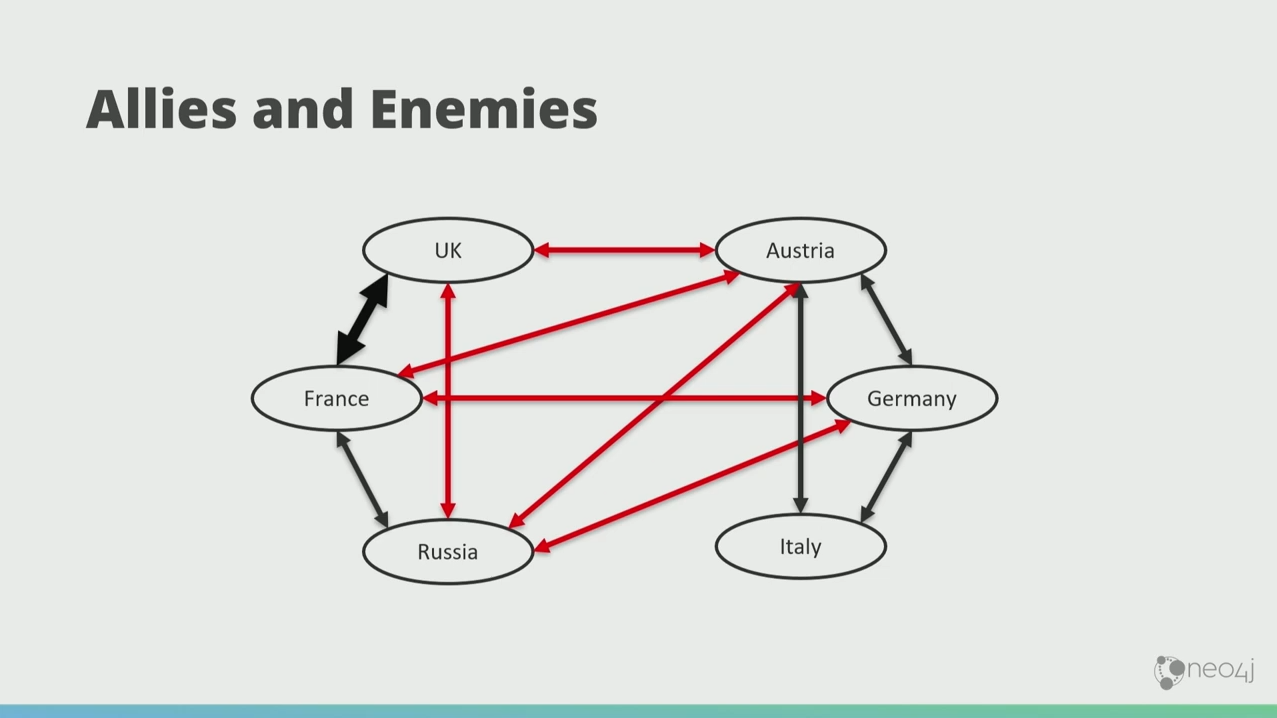
So what happens is that the Russians became friends with the Brits, and the graph naturally makes more triadic closures. Eventually, the graph falls into this low-energy state where there’s only balanced closures.

This is now the starting point of World War 1, perfectly according to the graph theory. This means that you can predict, particularly in social networks, the behavior of things in the future using graph theory.
Why Neo4j?
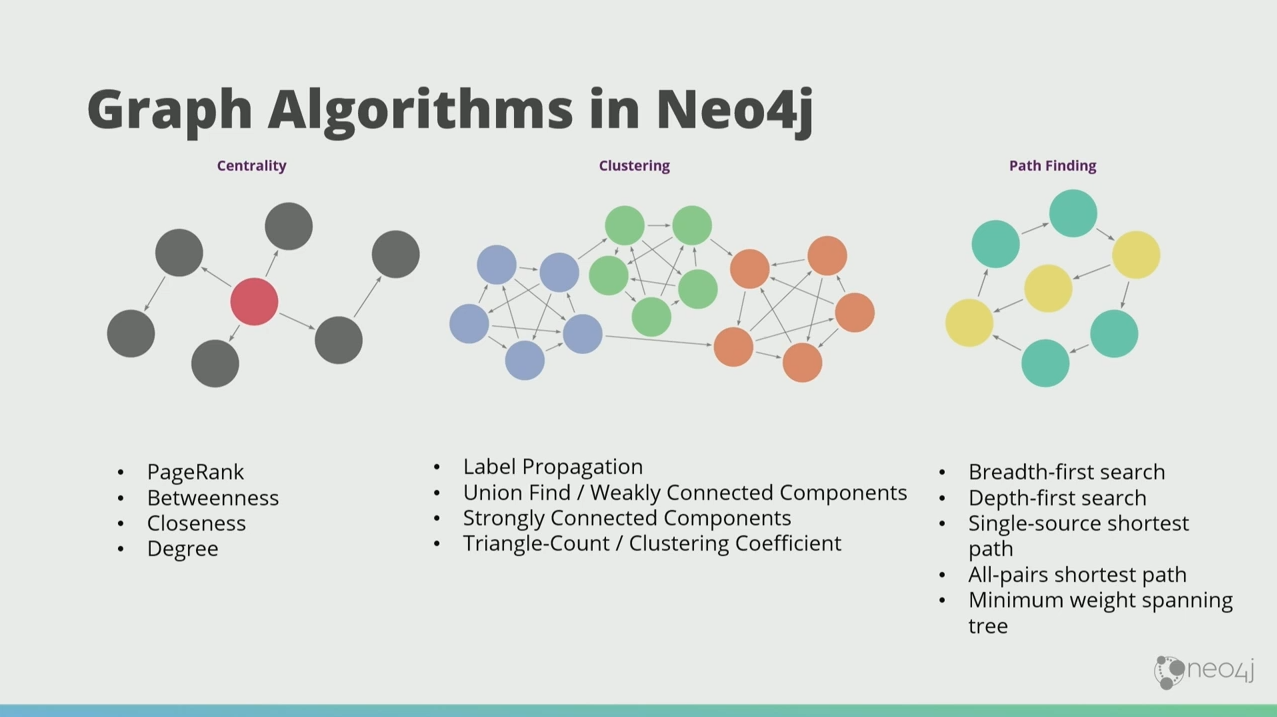
Neo4j has convenient, production-ready graph algorithms in the Graph Data Science Library, where you can just declare, “Hey database, process this for me… do label propagation… find weakly connected components… and so on.”
Because Neo4j is a native graph database, the results come back really fast. This is a PageRank run by my colleague Michael Hunger who told me, “I have a kind of pathetic desktop computer, and I ran PageRank on a large payment graph with 300 million nodes and 18 billion relationships.”
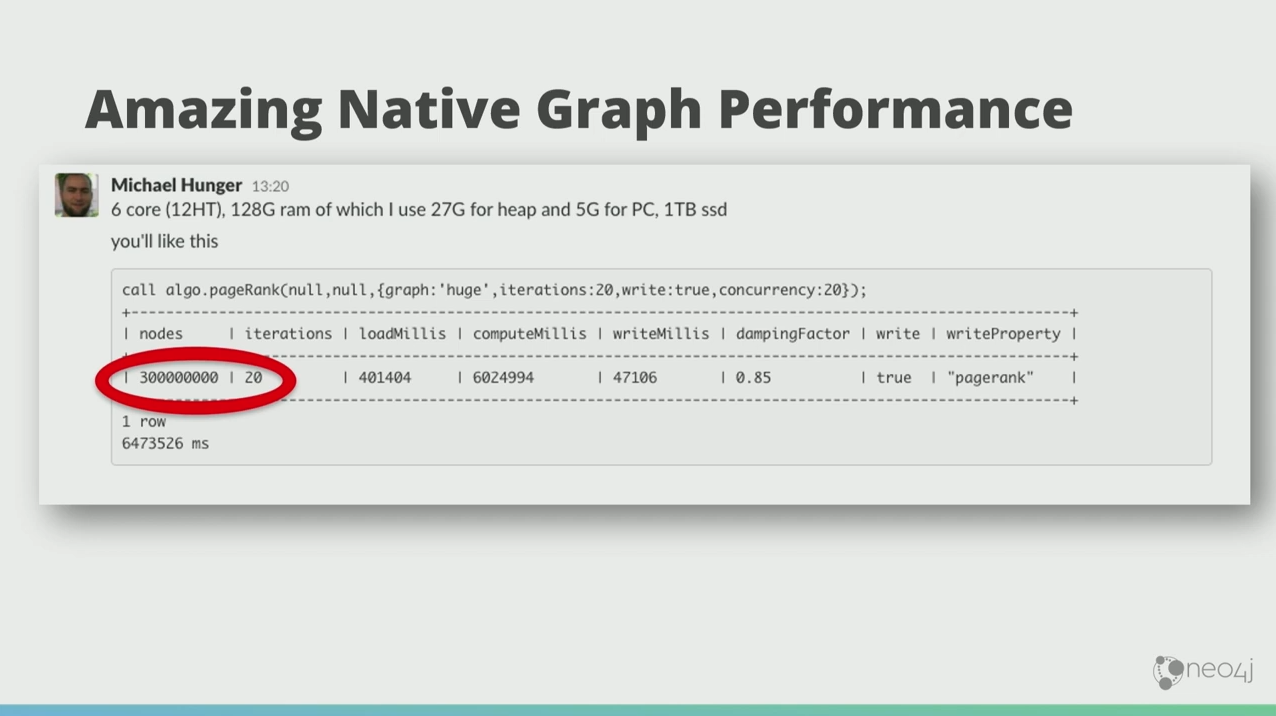
It took him two hours. But if you’re going to do the same thing on Hadoop, you can maybe finish it in a week if you’re lucky.
Detecting spam
There was a wonderful paper from KDD 2015 by Fakhraei et al, where they analyzed a social network looking for interactions that were spam.
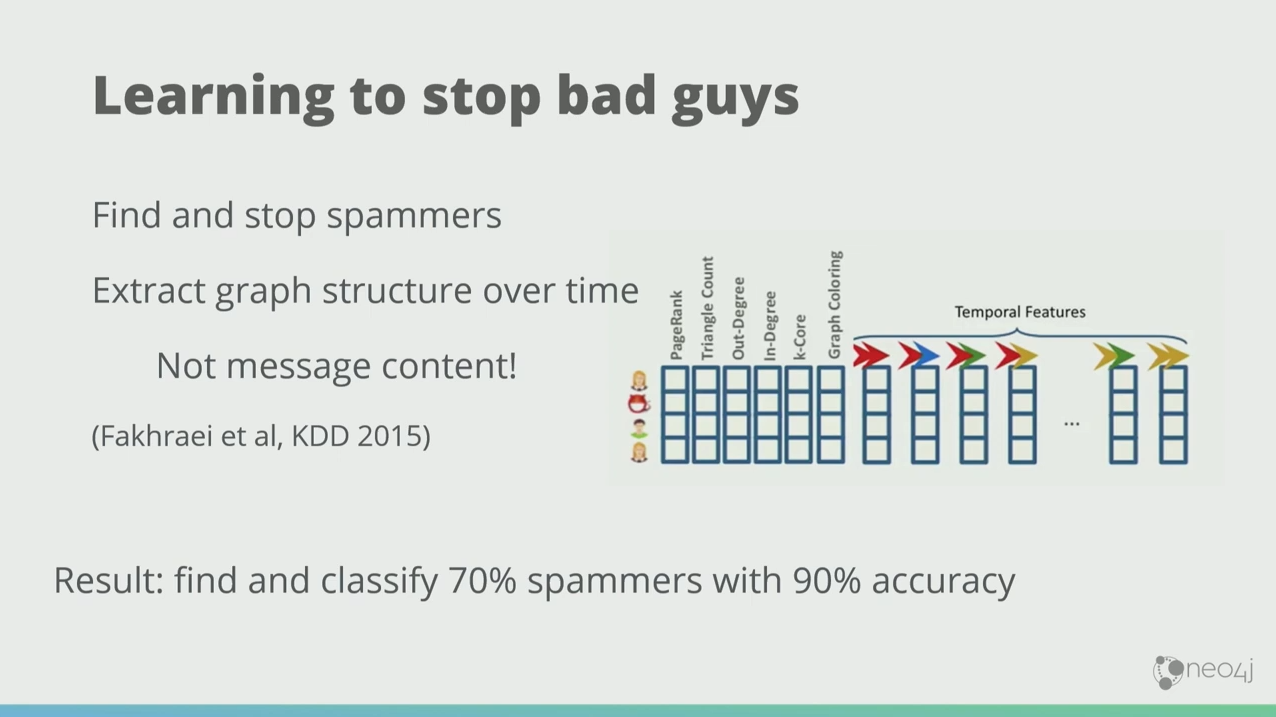
They didn’t need to look inside the messages for like Viagra or a Nigerian prince offers you free money kind of thing. They only analyzed the structure of the graph, and what they found was, just by extracting features of the graph, including PageRank, degree, color or label, they were able to classify 70% of those spammers with 90% accuracy before they even did any further.
Conclusion
The point is that the structure of a graph itself leaks a bunch of useful information, which you can take advantage of to build intelligent systems.
Graph machine learning is still mostly about extracting stuff from a graph, whether it’s a graph feature or the property data from the graphs, turn them into vectors, and pump them through your ML pipeline. You can also mix structural data with property data in order to get better predictions out of your model.
But you don’t always have to vectorize graphs. Graphs and artificial intelligence are natural bedfellows, but graphs can also be intelligent on their own.
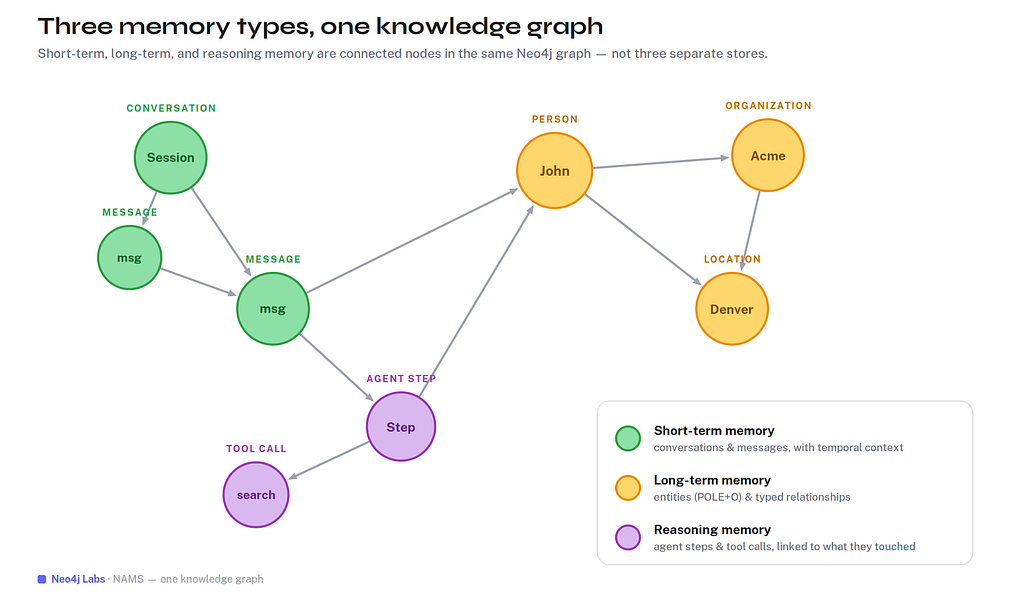
Knowledge graph is an example. You pull the sum of your knowledge into the graph, and then exploit that knowledge in domain specific ways with context. We’ve seen these be very successful at scale. The richly connected data in a graph itself makes the system appear intelligent.
Graph technology is the future that still has lots of opportunities for us to explore, connect the dots and build intelligent applications.
Get the Graph Data Science For Dummies book for free now.
Share Article


Explore
Related Articles
Neo4j Named “One to Watch” in Snowflake’s 2026 Modern Marketing Data Stack Report

Zero-Copy Graph Reasoning on Snowflake: Getting Started With Neo4j Virtual Graph

