Graphs for cybersecurity: Introduction
5 min read

Cyberattacks had been on the rise for years, with nation state threat actors and foreign hacking collectives joining in, devoting more time and resources to attacks. At the same time, the shortfall in talented staff available to fight these threats also increased.
Then the COVID-19 pandemic struck, forcing many businesses to shut down their physical buildings, creating an unprecedented demand and pressure on digital platforms as businesses shifted to securing work from home at scale.
Cyberattacks skyrocketed in 2020. The FBI saw a never before seen 300% increase in cybercrime reports in 2020. Between January and April 2020, there was a 238% rise in cyberattacks on financial institutions.
Software supply chain attacks, which exploit vulnerabilities in embedded open source libraries, increased 430% in 2020 and continued their meteoric rise with a 650% increase in 2021.
This is not news to those in cybersecurity. After all, it is a field characterized by extreme, unmanageable complexity. Something seemingly straightforward like Incident analysis requires pulling together data and logs from many platforms and tools. To effectively mitigate cybersecurity risks, we need advanced data solutions that empower us to correlate and analyze connections at a real-world scale.
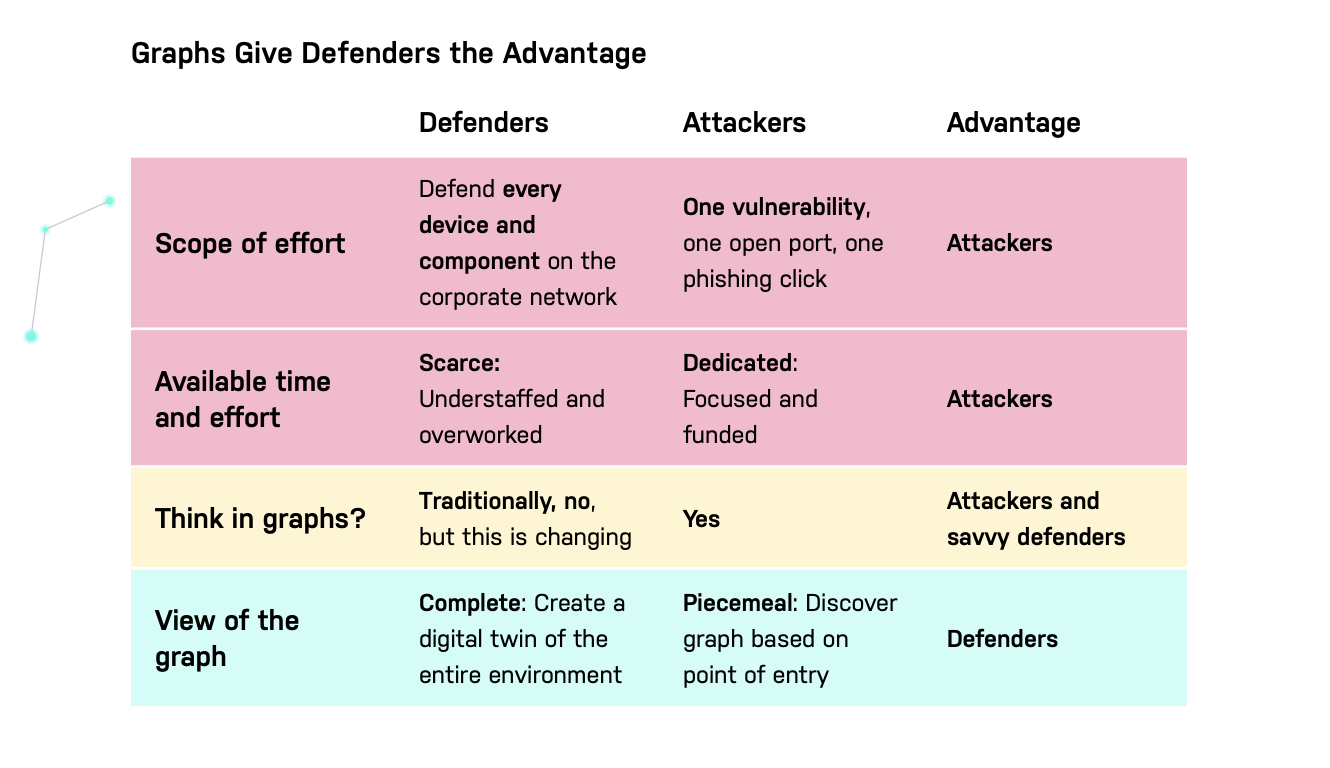
The odds are stacked against defenders
Security professionals have long lamented the difficulty of defending against cyberintruders. Consider the following:
- Defenders have a bigger job. They must protect against every possible attack and patch every possible vulnerability. Attackers need to find only one opening to land and expand.
- Defenders have many responsibilities. Attackers are often hyperfocused on finding exploits.
A graph for cybersecurity flips the script
Defenders traditionally rely on lists: alerts and logs from software tools. Such an approach blocks defenders from gaining a holistic view of their systems and creates blind spots.
Meanwhile, attackers are opportunistic. Attackers find a weakness – no matter how small – then exploit it to gain access to more of your network. They think of your network as a graph. If they get access to one node, they can build an attack graph from that node, working toward the most valuable systems and data.
Defenders can enhance their security posture by building a complete graph of their infrastructure and enriching it over time. Here defenders are at an advantage (for once). After all, the attackers’ “graph” is the developing understanding of the network structure as they discover it. The defenders’ graph should take into its sweep the entire infrastructure, creating a digital twin that is as complete as they choose to make it.
“Defenders think in lists. Attackers think in graphs. As long as this is true, attackers win.”
– John Lambert, Engineer and General Manager, Microsoft Threat Intelligence Center
Why graph databases for cybersecurity?
Graph databases easily capture the complexity of IT infrastructure and security tools. Graphs are the most natural way to process data because they provide a high-fidelity model of the real world.
Assess your needs:
- Does your organization maintain a live representation of your network structure for analysis? Are you aware of the most likely attack paths threatening your crown jewels?
- What is your organization’s plan for handling security breaches?
- What contextual information does your security team have to deal with it?
- Does your organization have processes to review user access rights and tools to help visualize a user’s security groups versus the rights they need?
A graph data model represents intricate networks of entities and their relationships, and uncovers patterns that are difficult to detect using traditional representations such as tables. Tables are good for collecting and processing data but they miss relationships between data points.
Graph databases are a strong fit for cybersecurity: they integrate many data sources, incorporate large data volumes, and easily reveal dependencies.
Security data comes from many sources; large organizations have an average of 75 security tools deployed. Each tool generates alerts and logs. And security tools are just one type of data source; many applications and services generate log files that are relevant to cybersecurity.
Alerts and logs produce voluminous data. Add to this the relationships in and across all that data, the dependencies and paths from one resource to another.
Modeling your infrastructure as a graph enables you to:
- Identify your most valuable assets (your “crown jewels”) and target security investments
- Generate alerts for relevant teams about the impact of incidents across systems
- Identify suspicious behavior, reducing the mean time to detection and uncovering insider threats
- Analyze and rationalize identity and access management to enforce the principle of least privilege
The advantage of graph databases increases with the size and complexity of the data. With a graph database like Neo4j you gain a unified visualization of the attack surface and the ability to conduct ongoing cyber risk assessment simply by connecting your resources and users with the activities on your system. You can have predictive, preemptive, and proactive threat identification and cyber risk management with clear attack paths and reachability routes. You can protect systems, detect anomalies in real time, respond with confidence to any incidents and recover quickly.
There are many ways to use graph databases to enhance cybersecurity. This paper focuses on one essential use case: creating a digital twin of your infrastructure by capturing it in a knowledge graph. That might sound like a big project, but with graphs you can start small, realize value, and expand your graph to provide more value over time.
Read the Graphs for Cybersecurity white paper written by Dave Voutila, Gal Bello, Tara Jana, and Deb Cameron, which consists of three parts:
- Part 1 describes the current threat landscape to provide context for those who are not cybersecurity aficionados.
- Part 2 offers policies and strategies to consider, with some simple graph queries to show you how you might implement them.
- Part 3 covers the basics of creating a digital twin of your IT infrastructure, including code samples.
The paper concludes with next steps, followed by an appendix with links to useful open source tools.
Share Article


Explore
Related Articles
Fraud rings hide in the connections: Graph-Enriched Detection for Databricks Genie with Neo4j

APRA just put the financial sector on notice over AI. Government agencies need to take notes.
Detect fraud faster with a transaction graph