


Graphs in Government: How In-Q-Tel Brings Tech Innovation to Intelligence Agencies

Federal Account Manager, Neo4j
3 min read
The use cases for a graph database in government are endless.
Graphs are versatile and dynamic. They are the key to solving the challenges you face in fulfilling your mission.
Using real-world government use cases, this blog series explains how graphs solve a broad range of complex problems that can’t be solved in any other way.
Last week, we took you through a case study with the U.S. Army using Neo4j to help fulfill its mission in areas such as supply chain management and maintenance cost management.
This week we focus on another case study, this time with In-Q-Tel (IQT), a nonprofit that works with America’s intelligence agencies to identify, invest in and support tech innovations that best match America’s intelligence missions – the most enduring and difficult problems facing U.S. security agencies.
Matching the Tech to the Mission
To find just the right technology for intelligence missions, IQT maintains a network of connections with VCs, startups, universities and technology centers. They evaluate tech innovations across sectors – including biology, space systems, communications, cybersecurity, analytics, infrastructure, Internet of Things (IoT), robotics, artificial intelligence, materials and energy.
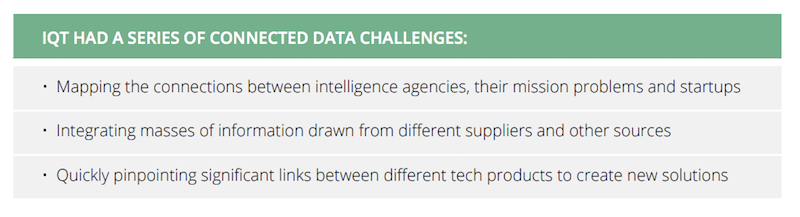
IQT’s ultimate aim was to break down product sets into core capabilities to both evaluate the merit of offering investment capital to the vendor while also understanding the components of its “technologic DNA,” which it then combines (or recombines with technology from other vendors) to create custom technology stacks that solve complex problems. However, this proved difficult because tech vocabulary varied widely by industry, technology and vendor.
“We had no way to automate these exercises,” explained CTO Ravi Pappu. “Technology evaluation and decomposition was done manually in spreadsheets and presentation diagrams. Tech suppliers were matched manually, and the process of identifying new product combinations was slow and generated few ideas. We needed a common lexical catalog for all the technology components.”
Pappu recognized that the best way to solve these issues was with a graph database. “Our tools did not reflect the connectedness of our data,” he said. “That’s what we solved with Neo4j.”
“The fundamental reason for us to choose a graph database over other systems is that there is enormous value in the relationships between different objects,” he explained. “We have many different data silos in our organization, and we wanted to do a JOIN across all of them.”
Thanks to Neo4j, IQT’s technical staff now develop technology solutions by searching through a wealth of internally created data, along with information imported from sources such as the U.S. Public Library of Science and IEEE, all integrated under one common taxonomy. The project has produced multiple benefits, Pappu said, including better product innovations.
“Neo4j is making it easier and faster to generate new ideas to present to the government,” Pappu said. “We are better at evaluating technology, too, and we can now see even better into future technology trends.”
Conclusion
As this blog series shows, Neo4j empowers government agencies and organizations in many different ways, from capturing knowledge to finding the latest technology.
Graph databases are as versatile as the government agencies that use them. In the coming weeks, we’ll continue showing the innovative ways government agencies are using graph databases to fulfill their missions.
Witness how leading government agencies are using Neo4j to overcome their toughest challenges with this white paper, Graphs in Government: Fulfilling Your Mission with Neo4j. Click below to get your free copy.
Share Article


Explore
Related Articles


From Data Chaos to Clarity: How Connected Data Can Improve US Government Decision-Making

The Most Powerful Fraud Prevention Tool for Federal Agencies: Graph Technology

Safeguarding Elections: How Graph Technology Powers Groundbreaking Research on Political Ads

Top Speakers to Watch Out for at GraphSummit Europe 2023
