
How Graphs Deliver our Strategic Vision at Packt Publishing

Senior Data Analyst, Packt Publishing
11 min read

Editor’s Note: This presentation was given by Greg Roberts at GraphConnect Europe in April 2016. Here’s the TL;DR of what he covered:
- Automated metadata generation using Stack Overflow tags and topic keywords
- Adding an ontology for context
- Parsing ebooks for keyword data and subsections
- Personalized recommendations for automatic page rankings and customer profiles
–
Today we’re going to talk about how to automate metadata generation.
You really only need two key ingredients: a set of topics and relationships between those topics. A great place to start is with Stack Overflow, a popular question-and-answer site with more than 10 million questions and 19 million users.
All the questions have tags related to their topics, which are maintained and moderated by the community. There can be multiple tags applied to a single question, which implies a relationship between those tags. Additionally, the weights of the topics’ co-occurrence are also the weights of the edge, both of which we can place into a graph.
Below is a graph of the most popular tags placed on the topic “graph database”:
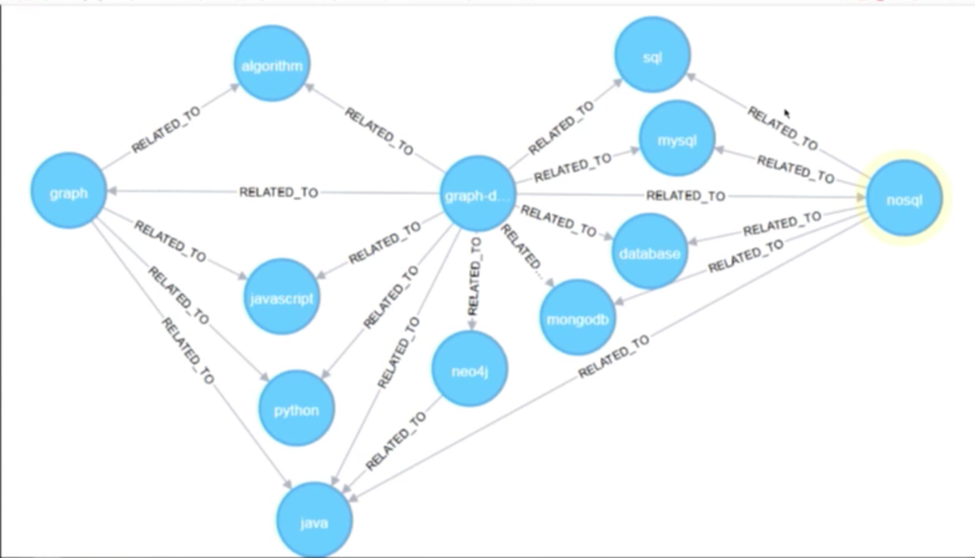
You can see we have concrete topics such programming languages and Neo4j, as well as more abstract topics such as NoSQL and databases. Based on the above, it’s already clear that there are multiple network effects we can take advantage of that will allow us to glean some insight into our data.
Next we need to attach this network of topics to our content. This can be done by taking the keyword-rich copy from our page about Rik Van Bruggen’s book, Learning Neo4j. After we filter down the keywords using the Stack Overflow tags, we get a much clearer picture of the content:
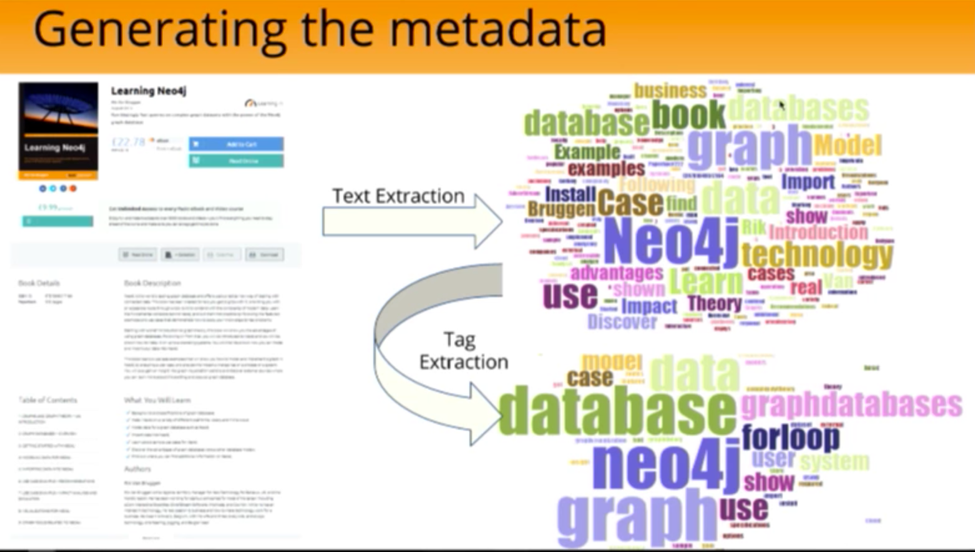
This is a good start, but there’s still too much information for it to be very useful. For example, we have the term “forloops,” which based on the above seem to be one of the most popular topics at Packt Publishing. But at this point, we’re just counting words — we really have no idea what the document is actually about.
How can we cut through all the noise and find some context? By using the frequency inverse document frequency algorithm (tf-idf algorithm), which balances occurrences of a term against the commonness of that term across all of the documents:

For example, if you have a word that appears in every document, such as “for,” it will have a very low IDF score to balance out the high term frequency (TF) score. This provides a clearer picture of words specific to this document.
If we apply this algorithm to the above metadata, the accurate weightings give us a much clearer picture of our terms:
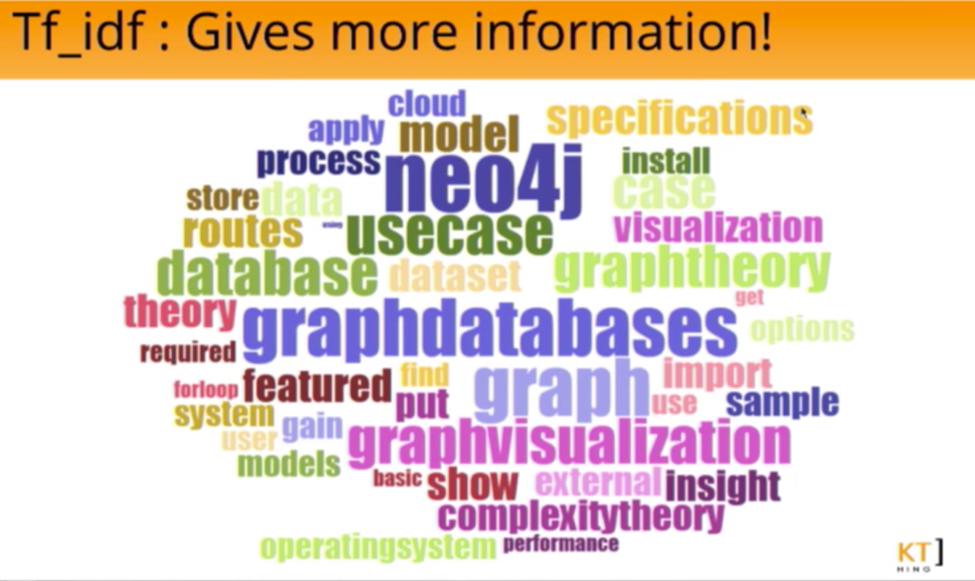
Now that we’ve built a complex picture of our market, we can start doing even more interesting things — for example, making visualizations. Below is a graph visualization on the top 1,000 tags on Stack Overflow and how they relate to each other:

The communities represented in the Stack Overflow network — web development, databases, programming — represent what’s going on in the real world. We also have key influencers, communities and clusters.
This provides us at Packt Publishing with a real-life use case. Because the Stack Overflow tags are attached to our products, which are then attached to our customers by purchases, we can segment our customer list and increase sales through tools such as personalized marketing.
It’s important to remember that the above graph visualization is an ideal example. In the real world, graphs can end up looking like more of a hairball with undefined clusters. So how do you decide which tags are your key concepts? We need some context for the data, which we can obtain by adding an ontology.
Adding an Ontology for Context
Ontology refers to a formal way of relating entities and relationships between those entities, which are easy to define in terms of the property graph model.
We started with the above small manual tagging exercise in which we extracted nodes and found a class structure based on the actions our customers took when searching for information. We also have classes that include programming languages, databases, paradigms and tasks that we can stick into a graph.
For example, we have Neo4j, a database written in the programming language Java:

The most important point here is that the ontology nodes are attached to the Stack Overflow nodes. We are essentially elevating those tags to indicate that these are the topics we are interested in. This means that we can use all the network effects from Stack Overflow to inform and grow our ontology.
For example, you could ask for all the topics and the programming nodes that connect them. You would end up with, for example, Python linked to Pandas and to NumPy. With a list like this, you can see that nodes like Pandas and NumPy are clearly frameworks for a given programming language (in this case, Python). Then, you can somewhat automate the process of growing your ontology, giving us key concepts and that context we need for personalizing our recommendations.
How do Add Value to the Data: Parsing Books
So — what do we have so far? We have most customer touch points and a reasonable view of topics, which is useful for performing things such as segmentations for outbound recommendation emails and things of that nature. However, we still don’t know much about how the actual content is being consumed.
Sure, we could stop at selling book X to person Y who wants to learn topic Z, but what would be more useful to our customers — and what allows us to truly deliver value — is to understand how they use the content, what they find interesting and how they organize their learning on the topic. To do this, we need the actual parts of the book — chapters and sections — and the usage data of people reading those sections.
Book parts are stored in .epub format, an XML that allows you to parse out the chapters, sections and subsections and place them in a graph. The below graph represents another Neo4j book — Learning Cypher — which has four chapters, each with their own sub-sections and attached Stack Overflow tags:

Now we have a much more accurate representation of what the book is about down to the page level. Again, we take all the Stack Overflow tags from the book and apply the TF-IDF algorithm, which returns a lot more specifics about Rik’s book:

While this is much more accurate, it didn’t carry over well to our other books.
Consider the following example. Another really popular book we’ve done recently is Python Machine Learning. Our search returns lots of specifics that are covered in the book, such as Perceptron, Scikit-Learn, Eigen, Flask and ADA:

But there’s something notably missing here: the word Python. This book is clearly about Python, so why is it not included above?
Python has a TF-IDF score of 0.03 in this book, which is below any cutoff you’d put in. And while that key term isn’t included, we do have a lot of Python-esque terms included such as Flask, Lasagne and gamma. How then, from that information, do you bring Python back into the fold?
We need to use another algorithm called Spreading Activation, which originates from cognitive psychology to model how memory flows around the brain — neurons activating other neurons. But it’s also used in information retrieval and can be applied generally to any sort of neural or associative network.
We start off with the picture that we had before — a piece of content and related topics that have been activated:

You then iterate over all those activated topics with that weight and add the connections between those and other topics. In other words, you spread that weight down through the network. In this case, it spreads from Keras and Scikit-Learn down to Python:

You end up with a new higher score and that will bring Python right back up to the top (note the increase in score from 0.2 to 0.8):

The final piece of the puzzle for the model is actual book consumption, which was easy to add in at this point because the subscription library logs every page view into a relational database.
The below graph shows a person interacting with a specific book over time, with the person in the very center of the graph and the other nodes representing sections and chapters. The sections that they’ve read are directly attached to them:
Once you start looking at data from multiple users, you can see that some chapters take longer to complete than others or that no one is reading the appendix, which is extremely powerful information to know.
Below is a bulk profile of all the people who have read Rik’s book, with the chapters represented on the X axis and the percentage of chapter completion on the Y axis. The blue line indicates how many views per section are present in that chapter, or “How often do people tend to come back to that chapter?”.
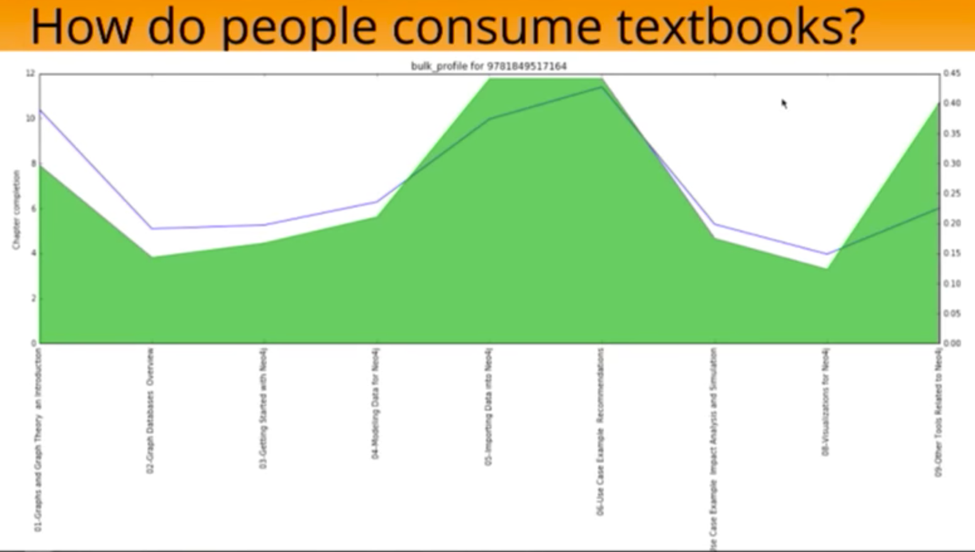
Based on this graph we know that the introduction gets high usage, while people tend to skip chapters two, three and four to get to the meat of the book, where they then spend most of their time. We can also see that the other related tools gets a lot of usage, while the visualization chapter does not.
This is incredibly useful to us, because it allows us to examine books at the chapter level, feed that information back into product development and determine how books should be structured.
We can also go back down a level and talk about different subsections of customers. If we compared the profile for an expert reader to that of a beginner, would they consume books differently? Would one of them skim chapters more than the other? And does that provide any actionable information to product development?
We could also go back up a level and look at how people interact more generally with certain types of books. For example, do people read the the introduction to cookbooks? If not, there may be no reason to include it.
Let’s go over the model we’ve developed so far:
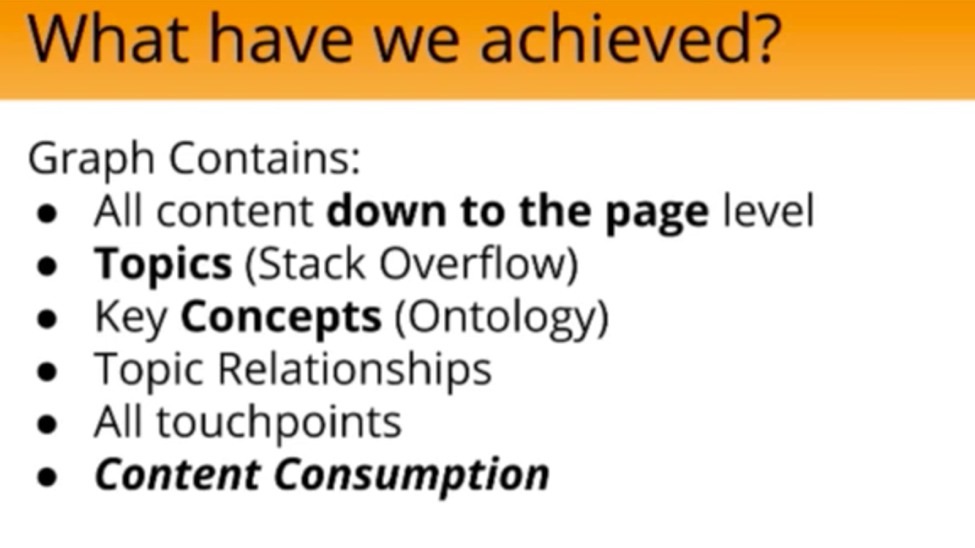
We have content down to the page level, but because the book is stored in an XML format, there’s nothing stopping us from going down even further and getting code snippets, titles, indexes and things like that. We could bring the code snippet in as well and add context to that and notice, “This is a snippet about setting up something, doing something with it.”
I’d like to now briefly cover how we’ve put this into production by going over the following production diagram:

We have Neo4j sitting in AWS, specifically an EC2 micro-instance. We have 1GB of RAM serving the entire website and we haven’t noticed any performance detriment, which is really a testament to the power of Neo4j.
That sits behind a Rails API, a thin wrapper around the server, while all the models for the different queries that we use are stored as Cypher queries. The API gets a request, looks at the Cypher query, executes the query on Neo4j and returns some representation back to be rendered on the frontend.

At the start of this talk I said that I wasn’t here to talk about personalized recommendations. Well, ultimately I lied there because everything that we’re doing is a recommendation. We’ve come a long way from a shaky VBA script to help people buy books at the cart. But ultimately, everything that we do is some form of recommendation put into a graph.
What specific sorts of personalized recommendations have we been doing? The two I’ll cover below are tech pages and customer profiles.
Personalized Recommendation Use Cases
Automatic Rankings
A tech page is how we classify all of our contents and book content, mostly non-book content, around the key topics in the ontology. Below is our Python page, with the most popular items at the top:

How does that actually get compiled? A request comes into the API asking for featured Python content, which executes a Cypher query. This returns the node IDs, which along with a clause are completely coupled to RCMS:
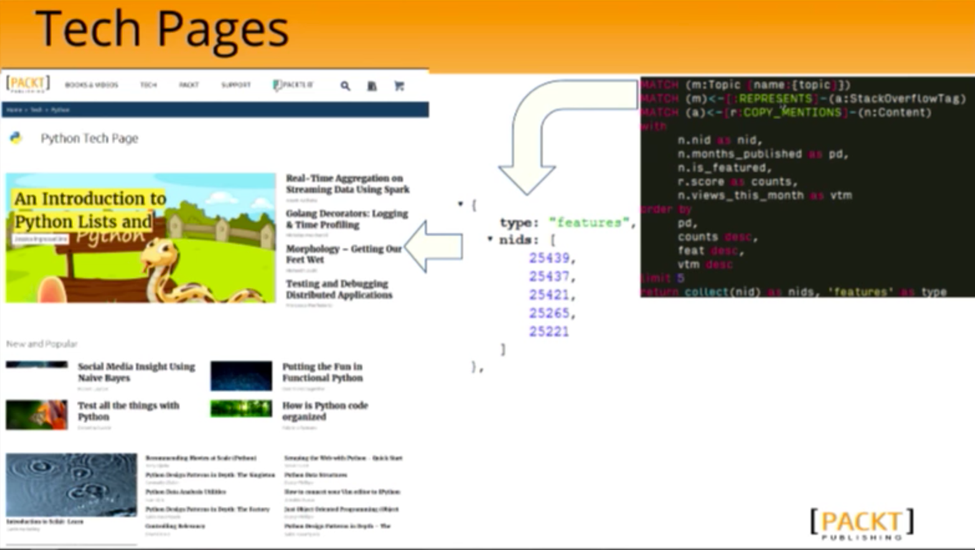
While we use the graph as a representation of the data, the actual rendering gets handed a list of IDs, which are hydrated by the CMS in the frontend.
This was really powerful for us for several reasons. First, it meant that as soon as a new article or blog was published — say the article for Python versus R for Data Analysis — it’s already been classified as being about Python, data analysis and machine learning, which allows it to automatically be posted on the topic page.
These are sorted by relevance, published date, whether or not it’s featured and how many views it gets in a month. If it’s popular and gets a lot of views, it will rise to the top of the page and might make it onto the featured page as well. All of this happens automatically via dynamic filtering, which has increased the engagement of our customers and driven content discovery.
Customer Profiles
We apply the idea of the spreading activation algorithm — concepts that are directly and indirectly activated — to customers as well. If one of our customers, Greg, is interested in Python, VBA, Sigma.js, Neo4j and Excel:
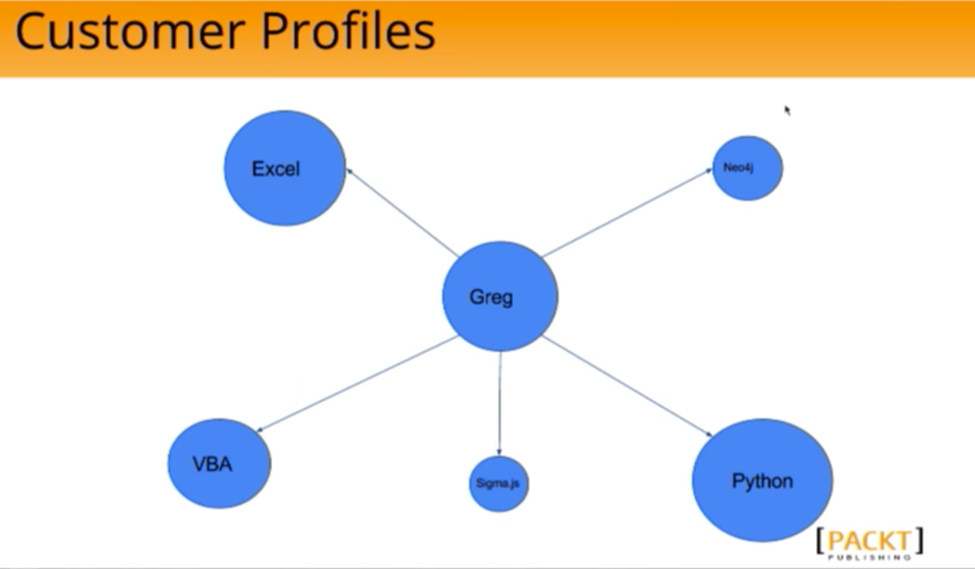
For every touchpoint you have with a customer, you do the spreading activation and add weights to the different topics in Greg’s customer profile. As time goes on, you have a time decaying that the profile will solve, push down things that happened more time ago and so you get a dynamic view of what people are doing.
Those relationships, which are from the ontology, include all the context we need to help people figure out what they are going to learn about next.
Let’s look at another user, Ted (below), who has a similar profile to Greg in that he is also interested in VBA and Excel. However, he’s using R, RStudio and Apache Spark.

Because we have the context for each of these topics, we know that Ted is a data analyst working with graph databases. He’s recently started looking at Apache Spark, so it will then be useful to recommend that I (Greg) start looking at Apache Spark.
What’s Next?
This powerful model brings many opportunities for Packt’s future, including graph-based search, modularized content and skill mapping:

Because we have recognizable terms that people actually use and recognize terms, we can use those to generate search. If we don’t initially have content on the term, we can use network effects to crawl and pull any information we do have. We can also personalize the search based on the user.
Modularized content is a bit far-reaching and is the idea that books don’t necessarily have to be books. For example — if chapter 1 from book A, chapter 3 from book B and chapter 5 from book C contain all the information you need on a certain topic, this provides a concise learning path.
The other application that we’re looking at now is skill mapping, in which we would map books onto careers. We would then put people in a place and allow people to track their career, link up with other data and do comparisons.
At Packt, graphs provided us with a truly natural way to think about and solve our problems. Extensibility was also key for us; we’ve had one data model that we made continually more complex by adding more layers of data, which is really only possible with Neo4j. Instead of focusing on the technical aspects of how to make the tool work, we can instead focus on solving our business challenges.
Inspired by Greg’s talk? Click below to learn more about personalized recommendations with this white paper, Powering Recommendations with a Graph Database.
Share Article


Explore
Related Articles


15 Best Graph Visualization Tools for Your Neo4j Graph Database


Empowering Open-Source Cyber Threat Intelligence Analysis With Graph Visualization
