
Graphs to Fight Diabetes

Head of Data and Knowledge Management, The German Center for Diabetes Research (D2D)
11 min read

Editor’s Note: This presentation was given by Alexander Jarasch at GraphConnect San Francisco in October 2016.
Presentation Summary
Alexander Jarasch is the head of data and knowledge management at the German Center for Diabetes Research in Munich, Germany. In his work, Jarasch looks to integrate the combination of research from a diverse span of independent analysts and use this information to better prevent and treat diabetes.
In this presentation, Jarasch chronicles the evolution of diabetes in humans. He briefly answers the question “what is diabetes?” and explains the objectives of the German Center for Diabetes Research.
From there, we dive into diabetes prevention and how to best fight diabetes. This introduces the data issue.
The specific challenge of the German Center for Diabetes Research is that its many scientists and experiments look at the customer from different perspectives. However, all of this information has to connect and overlap efficiently. This collection of data includes homogeneous and heterogeneous data, metadata and more. This is why it made sense for them to choose graph.
The presentation summarizes with real world examples concerning the metabolic nature of diabetes.
Finally, Jarasch speaks on what the future of graph looks like for the center’s research.
Full Presentation
My name is Alexander Jarasch. I’m from the German Center for Diabetes Research at the head office in Munich. I want to talk a little bit about our graph database and how we fight diabetes with graphs.
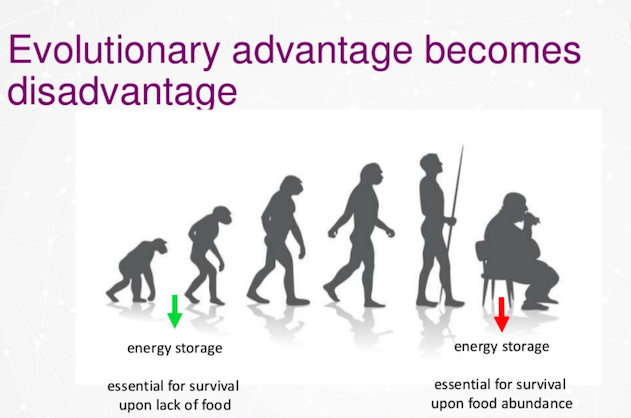
Evolution

In the times of the dinosaurs, and when there was no supermarket around, humans had the genetic advantage to store energy. They stored this energy as fat, for when food was less abundant.
This former advantage turned out to be a modern disadvantage. Now, we have supermarkets all over, we have an abundance of food, and we still eat a lot. This fat has been stored and stored and, as a result, we became overweight and obese. This obesity is a problem because it causes diabetes.
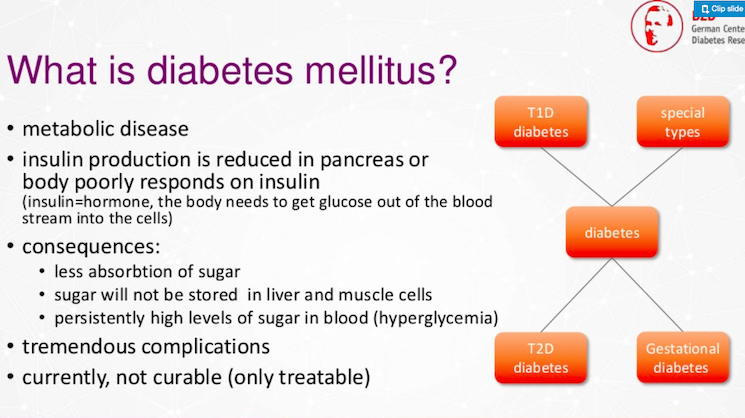
What is diabetes?

Diabetes is a metabolic disease. In some cases, insulin production in our pancreas is dramatically reduced. In other cases, the body poorly responds to insulin.
Insulin is a hormone and a protein that your body needs to get sugar out of your bloodstream. Consequences of having this sugar in your blood is that the sugar is less absorbed into your muscle cells or liver cells. The sugar stays in the blood vessels – this is called hypoglycemia.
Diabetes has tremendous complications, and currently, it’s not curable. Diabetes is only treatable.
When we talk about diabetes, we have the four main types:
- Type 1 diabetes
- Type 2 diabetes
- Gestational diabetes (diabetes at pregnant women)
- Additional forms we are currently studying
On the right side below, you see a picture of a healthy body. In your pancreas there are some cells that produce insulin, illustrated as little green dots. You see the stomach, and you get your sugar into the blood vessels. Then, insulin comes into play. If everything comes together correctly, then you get your sugar to the liver or to the muscle cells.
In Type 1 diabetes, which is roughly five percent of patients, these insulin producing cells get destroyed by your own immune system. There are roughly 20 genes that are involved in this process. This phenomena is independent from any lifestyle, it’s a gene defect and people are dependent on an external insulin source throughout their lives.
Type 2 diabetes accounts for roughly 90-95 percent of patients depending on the country. The cells are producing insulin but for some reason there’s an insulin resistance. The production is going on but the body doesn’t react on that. Normally, people don’t realize that they suffer from diabetes. More than 150 genes are involved in this process, which increases the risk of getting diabetes.
There is a cocktail of evil that encourages a diabetes diagnosis:
- You have a genetic predisposition.
- You are overweight.
- You lack adequate physical activity.

There are more than 400 million people suffering from diabetes worldwide. It was thought that this was a disease for elderly people, but actually two thirds of the people are in their working age.
There are another 200 million diabetics who are undiagnosed. This is a very problematic statistic. We have more than one million children suffering from diabetes – mostly Type 1 diabetes. Twelve percent of all the healthcare costs are caused by diabetes. This is a severe problem that we have to deal with.
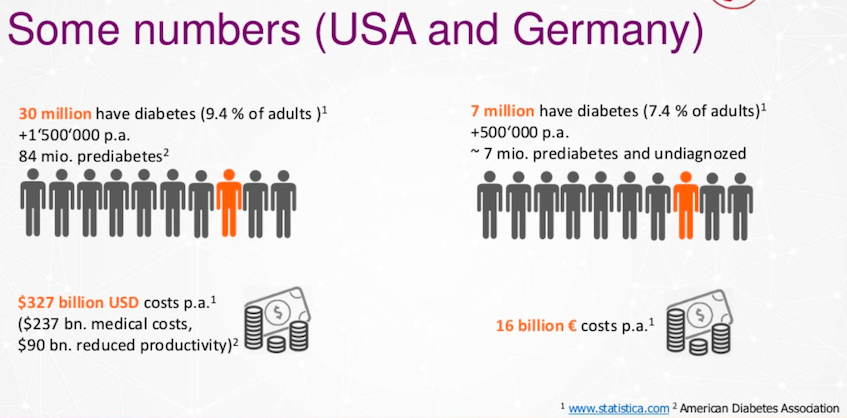
When we look at the U.S., there are 30 million diabetes patients. Every year this number grows. We have 85 million pre-diabetics patients, and 90 billion dollars per year comes from the reduced productivity of the people suffering from it.

This is a chart that summarizes 1985 to 2009. You see that this number is growing and growing, so even more people get diabetes and suffer from obesity.
Diabetes itself is not the real issue – people are dying from the complications. These complications are namely a stroke or heart attack. One third of all heart attacks are caused by diabetes. Nerve or blood vessels are degraded in your extremities, renal problems, and diabetic feet that have to be amputated are all complications that stem from diabetes.
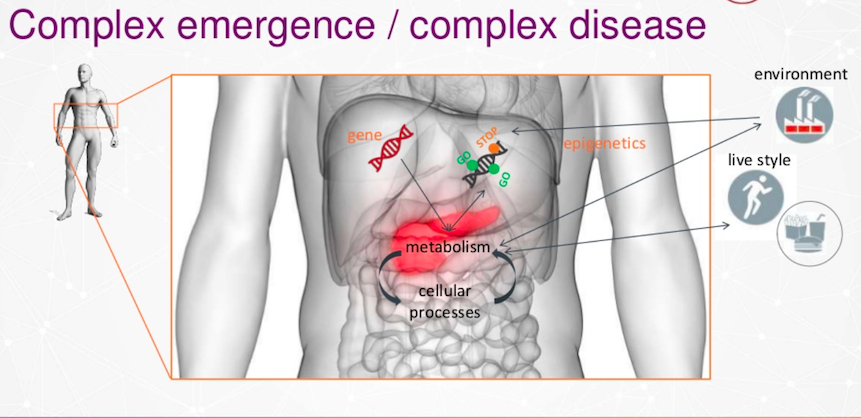
Diabetes is a complex disease. It’s in your metabolism and it affects the pancreas. Diabetes is also a cellular process that is dependent on your environment or your lifestyle, genetics or epigenetics.

A big problem on that list is your environment and your lifestyle. Your lifestyle is inherited by the next generation. When we see this with mice and human twins They are genetically identical but the epigenetics, which are these labels on the DNA, are different on that level. This causes diabetes, and on this level, you can transfer diabetes to the next generation.
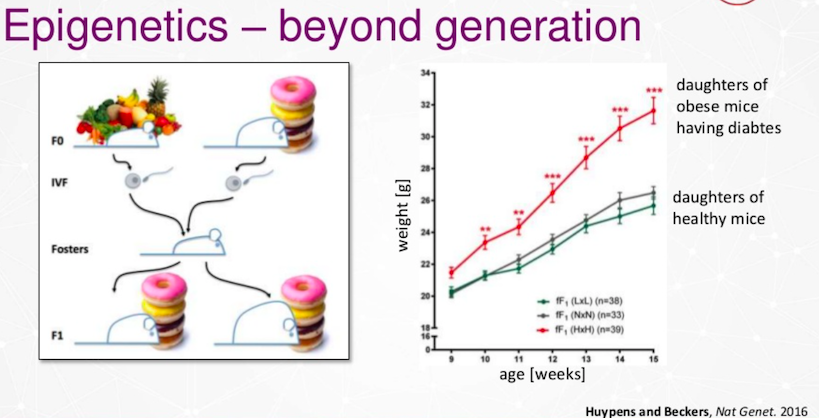
A group of our researchers had an experiment with mice. We gave some mice get a normal diet and other ones a high fat diet. Then we organized invitural fertilization and looked at their offspring The next generation gets overweight, and with this overweight, the risk of diabetes is dramatically increased.
Who We Are
We are the German Center for Diabetes Research. We are a federal institute and an academic/ non profit organization. We are funded by the Federal Ministry of Education and Research, and by the states.
We consist of five main partners in Munich, Tubingen, Dusseldorf, Berlin, Potsdam and Dresden. We have some associated partners, and overall, we have roughly 400 researchers from different disciplines ranging in basic research to university hospitals.
Our research areas are nutrition, prevention, genetics, cohort studies and basic research. Our main goal is to prevent diabetes, better treat diabetes and prevent these complications.
Diabetes Prevention
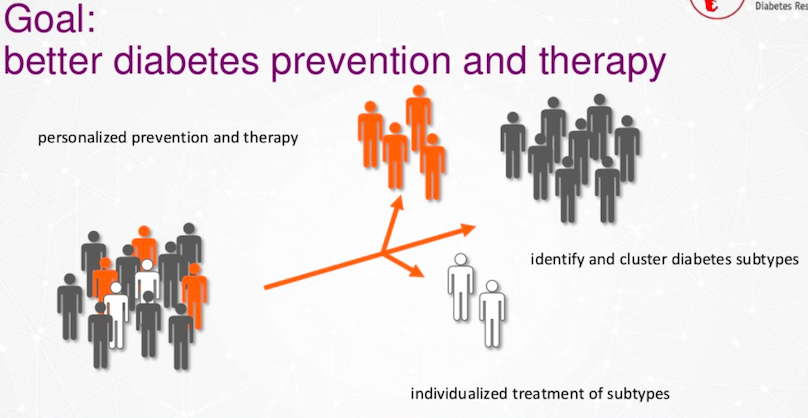
We want to prevent diabetes in these subtypes – Type 1, 2 or some other new types that we are currently investigating. In addition to that, we want to identify them with some intelligent algorithms and treat them in an individualized way.
How to Fight Diabetes
For the typical researcher, they are looking for information and for data within our organization. This is like looking for a needle in the haystack. Unfortunately, we have a lot of haystacks in the clinics and basic research.
The Data Issue

Usually these are easy questions like “what blood samples do we have?” or “what did we measure in the liver?” These answers become increasingly difficult to answer, and so our query grows more complex.
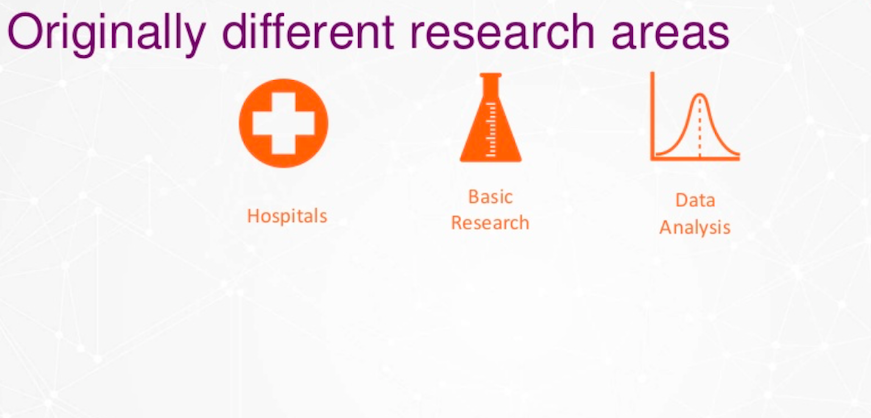
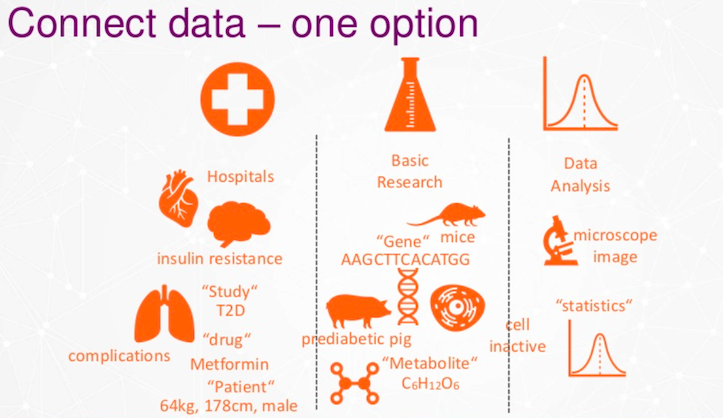
This data issue originates because we originally were three different organizations with different skills. We all used to work for the same customer, the diabetes patient.

However, everybody saw this diabetic patient a little bit differently. Some see it as an animal model, some look at microscopy pictures, and some look on the metabolite, etc.
Now, we have to look at our customer in a new way and combine the different types of data. In addition, that means that we have to share data.
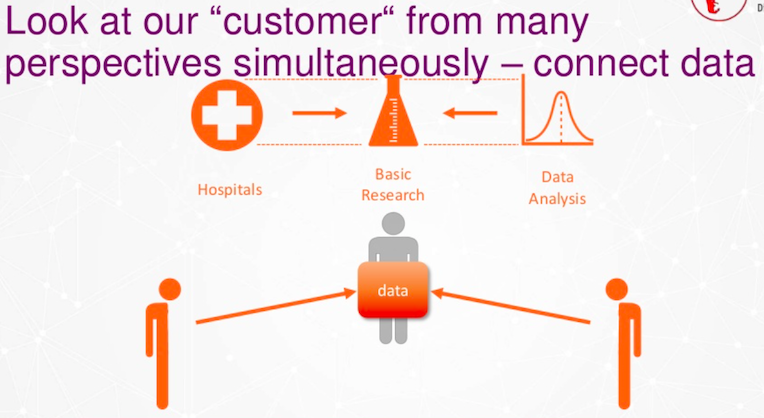
Now, we have to look at the customer from as many perspectives as possible, and that means we have to connect the data together.
There are two options. One option would be to develop all the databases separately.
Separate databases are not such a good idea. We want to build a new layer, so we chose connected data.
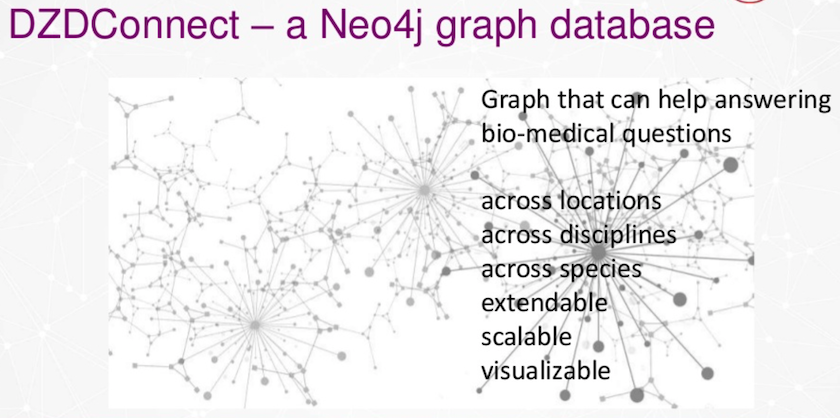
This is what we call DZDConnect. It’s a Neo4j graph database, and now this graph database helps us and our researchers answer bio-medical questions. These questions could be answered across the locations. As I’ve said, we have more than 10 different locations in Germany. We are able to answer questions across disciplines and across species.
This database should be extendable and scalable. One of the main reasons we like graph databases is because we have data visualization.
Homogenous and Heterogenous data
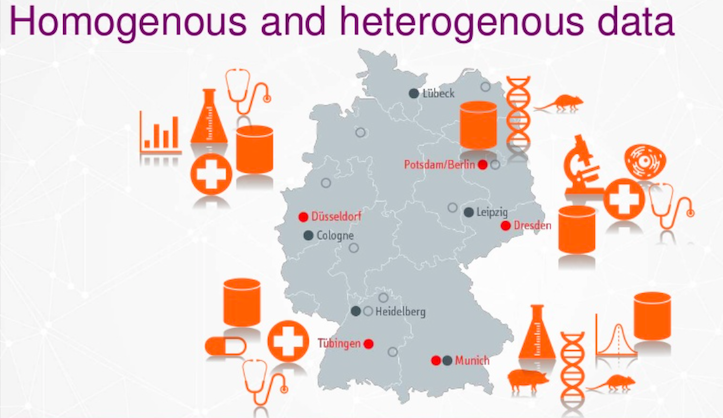
We have heterogeneous and homogeneous data. We don’t touch the raw data for data security reasons. We classify the data at different locations and give it labels. Finally, we connect the patients data so it is connected to each other. In the end, we reduce it to single labels, and this when the data starts to resemble a graph model.


Why Graph?
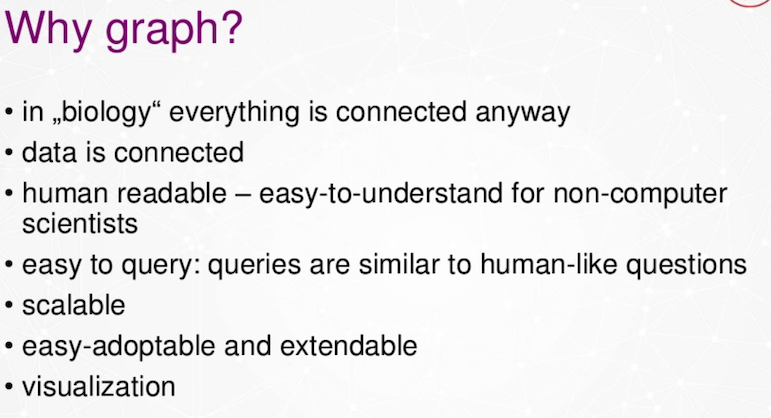
The first reason we like graph is because biology is connected anyway. All data and biology is connected. Our researchers like graph because it’s so easy to understand. The data model is human readable, even if you’re not a computer scientist. Also, it’s easy to query. I think it’s much easier to query than normal SQL.
Graph is also scalable and adaptable. When we have a new field, new discipline or new location, we can easily adopt the graph model. We can extend it, and have a very nice visualization.
Metadata
When I talk about data, currently we include metadata.
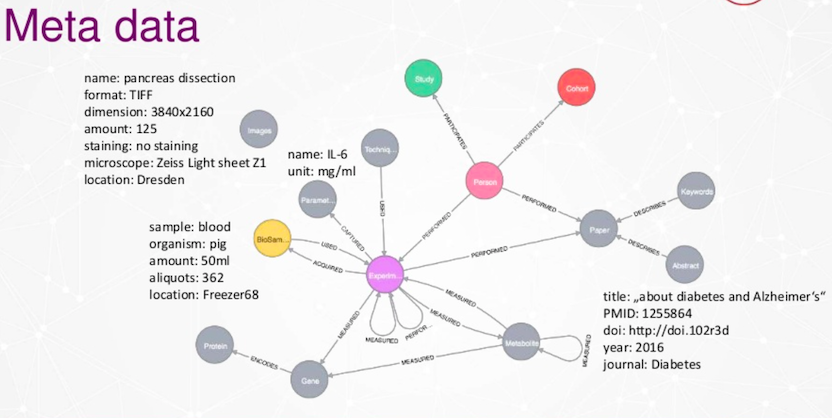
Above is our preliminary data model. Very big hop is an experiment because we are researchers, we do a lot of experiments. In these experiments, we measure different parameters with different techniques or devices. In some of our experiments, we collect bio samples like blood or urine. We also include data from publications like scientific peer reviewed publications. These are all connected in our data model.
Examples of metadata could be microscopic images. You install the dimensions, install the parameter name, the units, how it’s measured and so on. We have a bio sample database where we store our bio samples in liquid nitrogen.
We want to extend this graph.
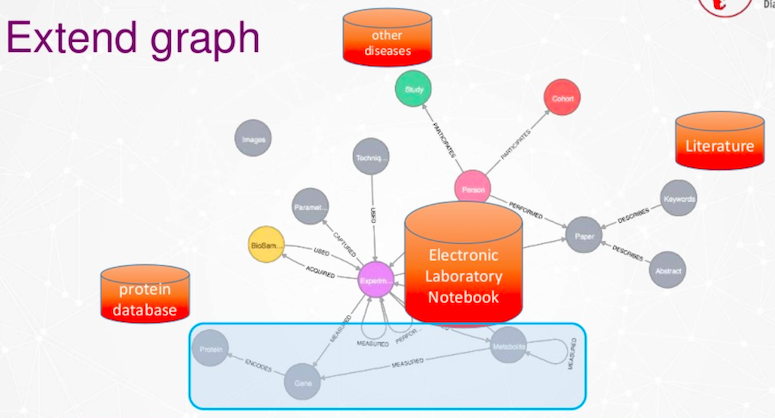
There are different possibilities on how we are able to extend graphs. One option is to extend it by other diseases like cardiovascular diseases, or Alzheimer’s. There are a lot of literature databases publicly available. We will include electronic lab notebook data, our protein database data. We also have a special case section where we enter the world of genes, proteins and metabolites.
Diabetes Is a Metabolic Disease
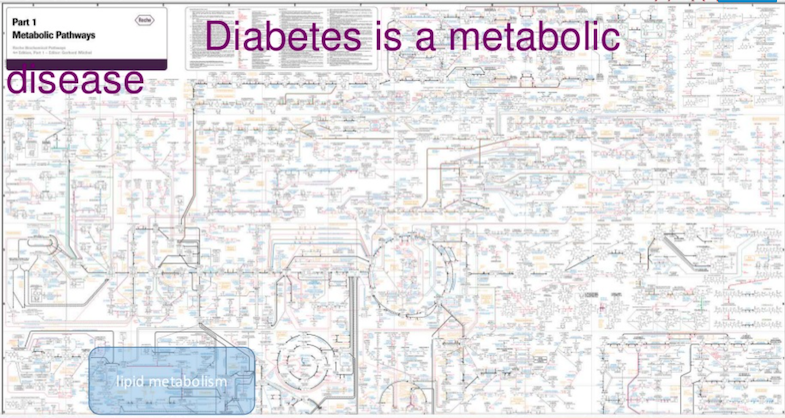
This is a very nice poster by Rush.
What you see here is all the metabolic pathways in your body, summed up together. Now we are focusing just on the blue box.

As we zoom in, you see it’s getting complicated. There are metabolites that are metabolized by enzymes, and they are regulated by other metabolites and so on and so forth. This database is very rich and very huge.
A startup company from the Helmer Center in Munich, called Knowing Health, dealt with this same problem. Their data model also uses Neo4j, and they connect these different worlds of genes, transcripts and proteins. Their Neo4j database is very large, it is 800 million nodes and relationships. We are able to include this database in our database.
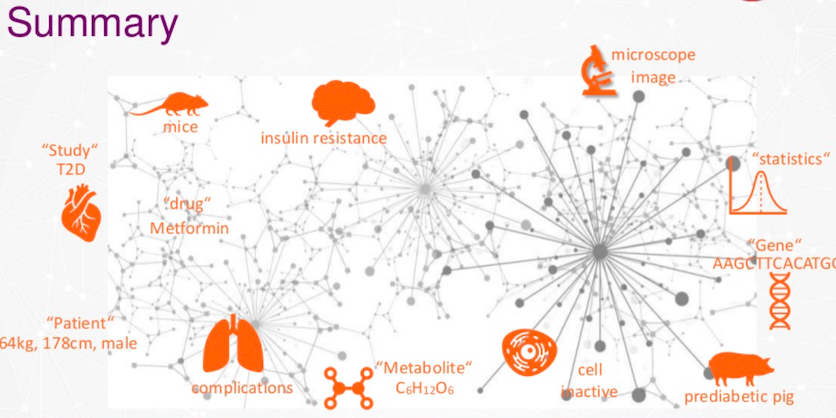
In summary, we build meta databases with graph technology, having different disciplines, different locations, and they are connected to each other.
Examples
One question that many of the medical doctors ask is, “How many of the biosamples were acquired in visit 17 in our clinical study?”
This clinical study is called the Prediabetes Lifestyle Intervention Study. We are interested in these biosamples. We want to know how they measured it. This question is not so easy to answer.
For this, we built a special data model.

We have a clinical study, the patients come in different visits. In these visits, the doctors make different experiments and they measure parameters. In some of the visits, they acquire biosamples that are stored and measure the data on it.
Our medical doctors go to the Neo4j graph database. They get their clinical study, then they extend it, they see the visits here, okay. Then they can browse to visit 17.
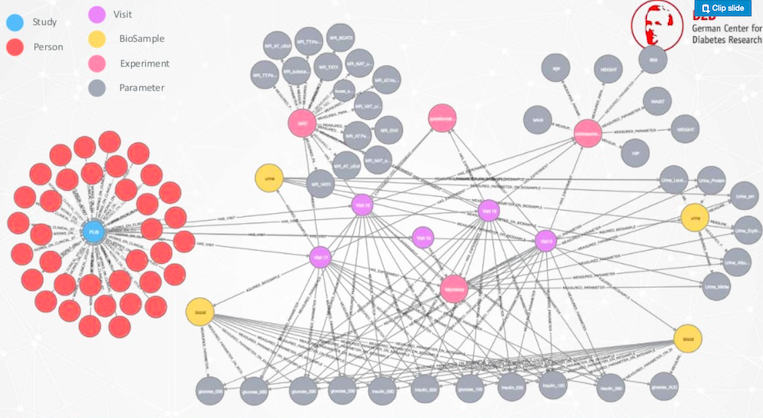
Now you see that it’s getting complicated. We have many different experiments in pink, we have the parameters in gray and biosamples in yellow. That’s why it’s so complicated to answer this question.
The second example is something completely different.
Here we want to connect data from different species, namely from humans and our pre-diabetic pig model. We ask the question, can human Type 2 diabetes genes be studied in our animal model?
To answer this question, you have to know that all these areas here are different research areas where many many people do research on that, and we have to connect them.
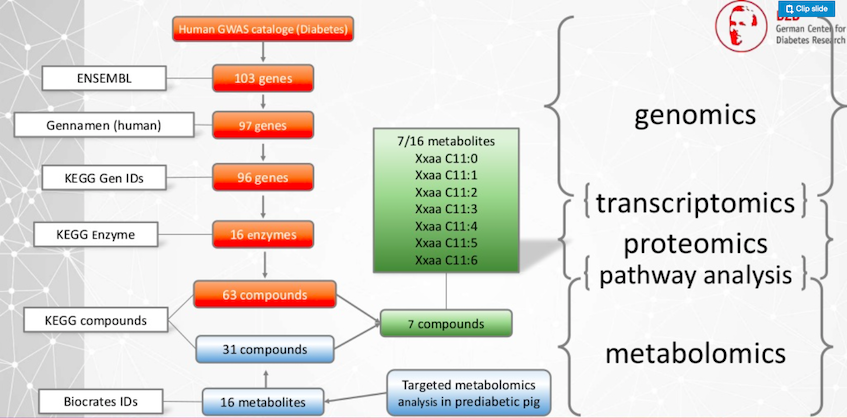
These genes are met through the different publicly available databases. They are turned into enzymes, and these enzymes metabolize different compounds. This is the human part of the data.
Now we have the pre-diabetic pig, where we have a targeted metabolomics essay. We measure 16 different metabolites, and in the public database, these 16 metabolites are 31 identifiers. Then we have a union of these sets and we come to the result that seven compounds between the animal model and the human data could be identified.
Now our researchers are looking into these metabolites in order to get new insights for diabetes.
Outlook
What’s the outlook? We want to extend our graph by literature data that is publicly available. We have below peer-reviewed articles in a very large database called Pubnet.
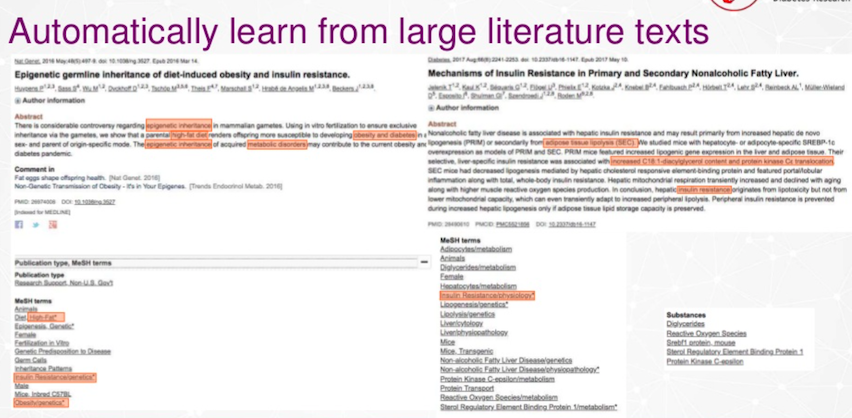
There are 30 million texts in Pubnet. These texts are about all the different basic research areas, and nobody can read all the texts anymore. When you’re looking for diabetes, you know, it’s the bottleneck that you are able to read. We want to do that automatically by applying graph algorithms on these texts to learn gene names or to learn diseases or some specific terms for it.
In the end, we want to do it for many many texts and see what are the connections between the texts.
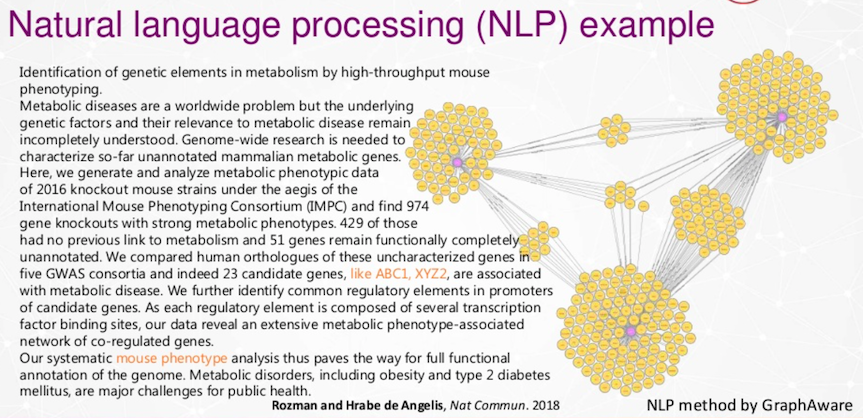
Every purple node here is a text that is analyzed by natural language processing procedure by Graphaware, then we see the overlap between different research texts.
We want to find these connections.
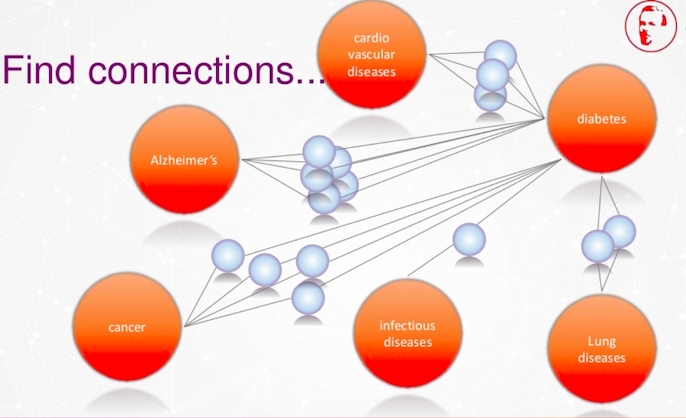
We also want to find connections between cardiovascular effects, Alzheimers, cancer, infectious diseases and lung diseases.
The orange dots here are all organizations like ours, like the German Center for Diabetes Research. We want to connect with each other to fight diabetes, or to fight other diseases.
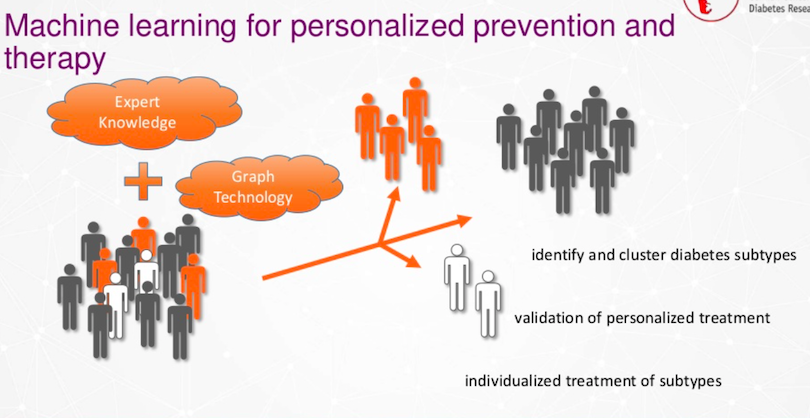
We have our people here that have different subtypes of diabetes or other diseases, and we have the expert knowledge because we have the researchers, the medical doctors and clinics. We combine that now with graph technology and we are on the way to better identify it or cluster new subtypes of diabetes to have an individualized treatment or an individualized prevention of them.
This should be a new center coming soon called the Digital Diabetes Prevention Center.
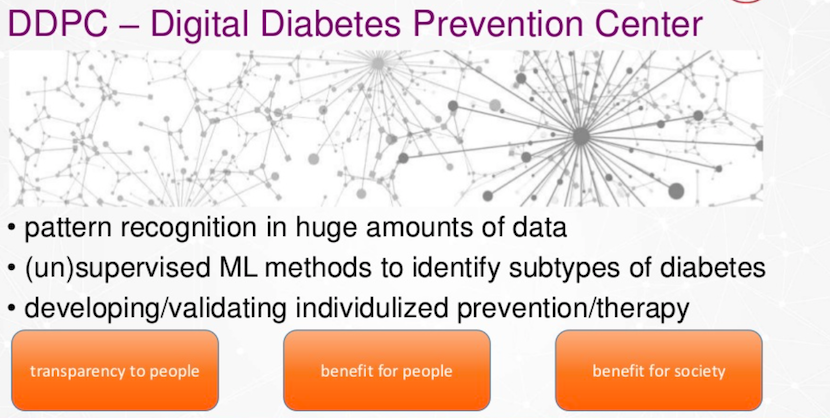
We want to do pattern recognition on huge amounts of data that people from the society give us. We want to do supervised or unsupervised machine learning techniques in order to give back a benefit for the people who gave the data, and of course, benefit for the whole of society.
In my opinion, graph technology enables us to have a new level of diabetes prevention and treatment.

We see events that we couldn’t have seen with relational databases. This is because we connect different disciplines, locations and species.
I want to acknowledge the funders, the Federal Ministry of Education and Research and the states. I want to thank all the scientists of the DZD and I want to thank the organizers here at GraphConnect for such a nice conference.
Grab yourself a free copy of the Graph Databases for Beginners ebook and get an easy-to-understand guide to the basics of graph database technology – no previous background required.
Share Article


Explore
Related Articles


What Are the Different Types of Graph Algorithms & When to Use Them?


What Is Data Lineage? Tracking Data Through Enterprise Systems
