
Graphs4Good: Insights into Police Misconduct with Graphs

Senior Director of Developer Relations, Neo4j
4 min read
On June 24, 2021, George Joseph of the Gothamist published a piece entitled “Mapping the Clusters of New York Police Department (NYPD) Officers Repeatedly Accused of Misconduct.”
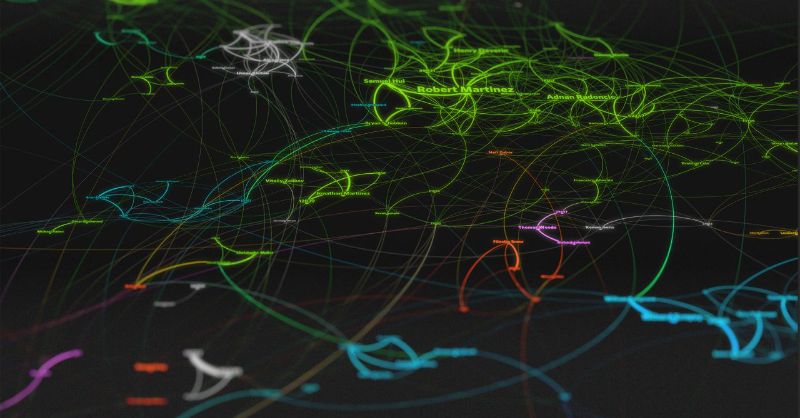
Together with independent data journalist EJ Fox, Joseph detailed how controversial police conduct is often a group behavior. The article presented an explorable visualization and map of officers tied to complaints since 2010.
A close-up image of some of the officer nodes connected to former 75th precinct Sergeant Robert Martinez
This article was remarkable in the insights that it drew out of a complicated social phenomenon, and pointed to hidden patterns that continue to happen in the real world. Investigating certain key officers who appeared to have patterns of misconduct complaints, Joseph found many salient examples, such as one officer who had recently retired after being caught on camera using a banned chokehold in an arrest.
Why Graphs Are So Effective Here
At this point, it should come as no surprise that Neo4j was heavily used in this analysis. Finding patterns in relationships is one of graph’s sweet spots; it is truly “all about the relationships” and cases like these are situations where the relationships between officers, complaints, citizens, and so on matter more than the individual complaints or officer records.
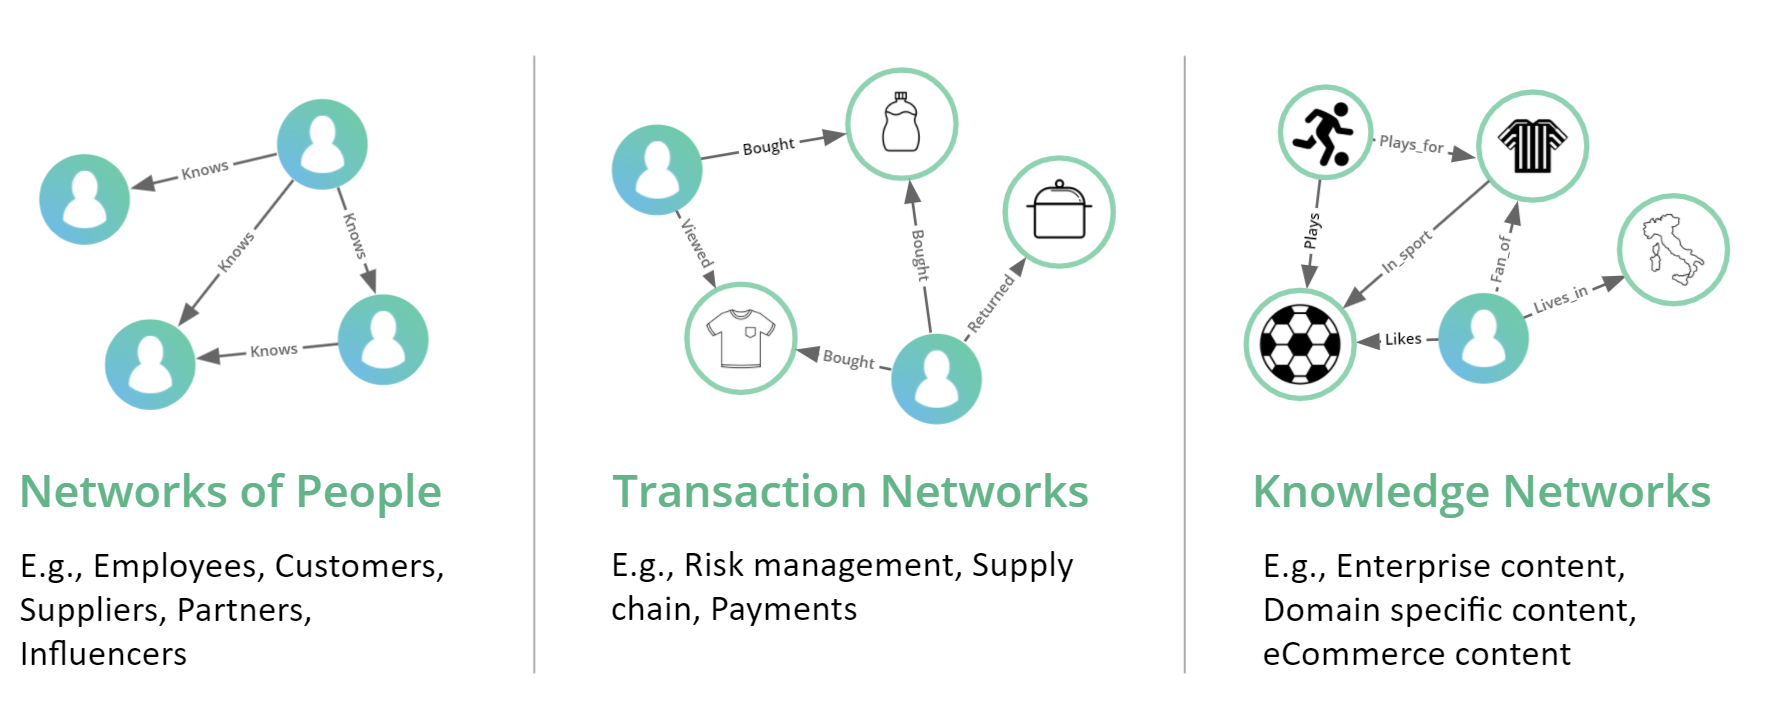
Connections in Data are as valuable as the data itself
If you’re wondering how this team did the work, EJ Fox wrote an excellent technical breakdown of the analysis. In it, Fox describes:
- What his data was
- How he used Cypher’s LOAD CSV approach to import data
- How he connected substantiated citizen complaints to officers
- How he established connections between officers.
I’ll leave the technical explanation to EJ’s excellent technical breakdown, but the “secret sauce” here that really pulls things together was the use of Neo4j’s Graph Data Science library, and in specific, Eigenvector Centrality. This particular algorithm measures the influence of certain nodes in the graph. In EJ’s case, it helps find officers with repeated complaints closely related to (or working with) officers who also have repeated complaints.
Neo4j Graph Data Science is one of the most exciting things about working in graphs these days. Eigenvector Centrality is just one of 50+ “tools in the toolbox” for data scientists, analysts, and even data journalists to pull insights out of their data. It’s driving the “graph take” on data science, and is already being used by many of our customers for connecting research databases at the German Center for Diabetes Research, and helping ferret out financial fraud.
Graphs4Good
The Gothamist’s article isn’t the first time Neo4j has been used for this sort of project. A few years ago we launched the Graphs4Good project to connect and enable people who work with data so they can be more effective. In the data journalism space, Neo4j has previously been used to uncover hidden tax shelters, detect patterns in election manipulation on social media, and save taxpayer money by helping NASA learn from their collective knowledge of past missions.

Neo4j has sponsored Pink Programming and gotten involved in the community to help women advance as a vastly underrepresented group in the technology sector.
And we’re open for business for projects that help discover connections in real-world data. Via the Neo4j Data Journalism Accelerator Program, data journalists like EJ can get some help untangling the real-world networks we find all around ourselves.
What’s Next
As a technologist myself, I want to explain all of the things that went into this analysis and how it ties to the technology strengths that Neo4j as a native graph database has. I’ve only given you a taste in this post, because EJ Fox’s article covers it so well.
And in a technology deep-dive, there’s always a risk of losing the forest for the trees. There are many powerful and cool things you can do with Graph Data Science, but in this post I wanted to draw attention to the big picture. Graph technology fundamentally lets journalists uncover insights about the real world, and graph utility contributes to understanding our world more. It may even help people understand how to take steps towards improving it.
If you’re curious about graphs yourself, we’d love to hear from you. You can start using Neo4j AuraDB for free in the cloud without a credit card, or check out the Neo4j Community Site, where you can find a large and vibrant community of people using Cypher, GDS, and all sorts of other technologies to do the same thing you see here, across every industry and use case.
Happy graph hacking!
Share Article


Explore
Related Articles

What Are the Different Types of Graph Algorithms & When to Use Them?


Turning Your Tabular Data Into a Graph Using Cypher
Mix and Batch: A Technique for Fast, Parallel Relationship Loading in Neo4j
