Harnessing the Power of Neo4j for Overhauling Legacy Systems at Adobe

Co-Founder & Engineering Lead
1 min read

Editor’s Note: This presentation was given by David Fox at GraphConnect New York in September, 2018.
Presentation Summary
Adobe’s Behance, a platform that allows people to showcase and discover creative work in a social media-type setting, was relying on a Cassandra-based legacy system that simply wasn’t working for them anymore. This was largely due to a fanout model that required hundreds of thousands of writes and a lot of babysitting from an already small ops team.
By focusing on overhauling a legacy system, they knew they could demonstrate real metrics that showed the benefits of switching over to Neo4j. The new Neo4j infrastructure included replacing a fanout structure with a tiered relationship structure, a three node cluster, causal clustering that also offered a robust backup solution, and a dark launch that provided the ability to test the product before it went live to users.
Switching to Neo4j brought a lessons learned from performing their legacy system overhaul can be applied to any industry and project that you might be working on.
Full Presentation: Harnessing the Power of Neo4j for Overhauling Legacy Systems at Adobe
What we’re going to be talking about today is how Adobe used the Neo4j graph database to overhaul its legacy systems:
I’ve been using Neo4j for the last five years across a variety of scenarios, including deploying to production for various use cases, for personal projects, and on an activity feed project at Behance. These projects opened my eyes to using Neo4j in a whole new capacity, because it became clear that it could be used for more than just experimentation or adding a new feature. Instead, it could be used for overhauling a system that already existed.
In this presentation, I’m going to start off with an overview of Behance, why we decided to focus on legacy systems, the nitty-gritty technical details of our graph model and setup, the results and lessons learned.
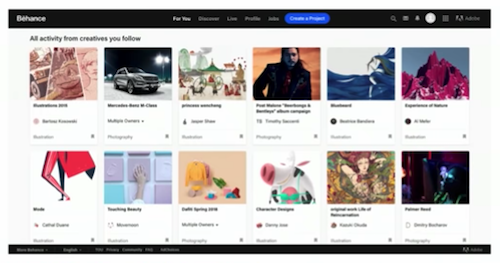
What Is Behance?
Behance is the leading online platform to showcase and discover creative work. We have more than 10 million members, and we allow creatives to share their work with millions of daily visitors.
This allows artists to showcase the Adobe software they used to create their work, which then drives more people to use Adobe Creative Cloud products. There is also a social aspect with the discovery, learning and teaching that comes from this Creative Cloud community.
Why Convert Legacy Systems to Graph?
Why did I decide to look for legacy systems that could be converted to graph in Neo4j?
With a legacy system, you’re already well aware of its pain points and know what you’re looking to improve. There’s low hanging fruit, often because people are actively complaining about some aspect of your current system, such as its age or speed. And, because you have a point of comparison, you can clearly prototype and demonstrate with real numbers how a graph solution is better than your existing system, which was really important for us.
The Method
In 2011, we used MongoDB for introducing the activity feed, which at the time was 125 nodes in a dataset of 20 terabytes. In 2015, we had 48 nodes in a dataset size of 50 terabytes, and switched over to Cassandra. In 2018, we switched to Neo4j, and went down to three nodes in a dataset size of only 30 to 50 gigabytes.
Let’s go over how we got there, and the techniques we used to convert to the new system – an example I think can be used across a variety of use cases.
Issues with Mongo and Cassandra
We ran across a variety of issues with the softwares we used previously. With Mongo, the reads were extremely slow due to a convoluted data model – but people really liked the features we were offering in our product.
When we switched to Cassandra, we fixed the slow read problem by introducing something called fanouts, a strategy commonly used in social feeds. But this approach became problematic as our app grew in terms of users and data, which put a large overhead on our web infrastructure. This required a lot babysitting from our ops team, which ended up being a huge drain on an already small team.
With Neo4j, we fixed the writing problem, maintained the fast reads and also ended up with a number of additional benefits that we’ll get into a bit later.
Below is an example of our Cassandra fanout model:

The left-most node is our Behance “power user,” who published a new project. In a fanout model, we write this piece of data onto the feeds of each of that user’s followers.
It’s not uncommon to see a popular artist on Behance have 10,000 followers, which would require 10,000 individual writes to get a new project published on each follower’s feed. You can see how this becomes extremely cumbersome as a user’s popularity grows along with the size of your database.
Goals with Neo4j
But why Neo4j?
At the time, no Adobe team was using the graph database, and introducing new software into any company can be a hurdle, which is why we had to really sell it to our leadership in a certain capacity. Because it’s incredibly easy to create a proof of concept in Neo4j, we were able to load a ton of data right onto our computer and quickly build a prototype that showed what switching to Neo4j could do for us.
We were able to compare this to the system we were currently using, and show many resources we could save by switching to this new system. And, with a reduced go-to-market time, this was incredibly appealing to management.
The goals and KPIs of our project were as follows:
- Flexible, efficient, robust system that was extensible
- Minimal “routine” maintenance/upkeep (Goal: close to no maintenance for the operations team)
- Minimal data storage requirement (Goal: Less than 100gb total)
- Minimal cluster node count (Goal: 3)
- Reduced overall complexity
- Maintain fast feed loading
- Maintain same user-facing feature-set
- Lower cost of running the feature
The Infrastructure
Now let’s dive into the technical component of how this all works, relative to our Cassandra fanout strategy. It’s a concept that I call tiered relationships, which I think can be useful in a number of use cases that involve replacing a system that holds a lot of relationships, and the potential for supernodes.
Neo4j stores relationships by type and direction, so if you’re accessing a lot of relationships that are the same type and direction, either coming into a node or going out from a node, you’re going to end up with slower path traversal – which is the supernode problem. But we wondered if there was a way to actually take advantage of this, which is how we arrived to tiered relationships.
The concept is that you offer your queries different levels of access by creating relationships that store different numbers of the latest events. Rather than storing all the data, they give you a granular view of the actual data.
This means you’re storing more data than perfectly normalized, but you’re getting a huge optimization and are writing far less data than the fanout strategy. It’s incredibly useful for feeds and follower-based systems, or any system where you might run into a supernode problem.
Here’s an image of a very obvious, basic relationship that you might find on Behance. We have an action called “appreciated,” which is similar to “liking” someone’s post on other platforms:
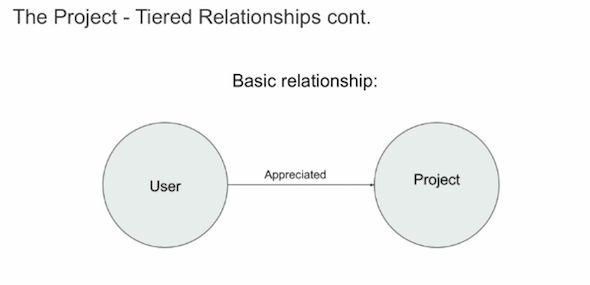
This would be a really basic storage of that relationship, a user appreciated a project. And we do use this model, but in addition to that, we used tiered relationships:

We have the relationship “has recent action 200”. This means that in that particular relationship, we’re storing the user’s last 200 actions, as well as the type of each of those actions.
If we want to load a feed for a user that’s following just a few people, we could access “has recent action 400” and query those people’s last actions. But if we’re loading the feed of someone who follows a ton of people, we could optimize this by analyzing the last 200 actions of each of the people they follow. It creates these different views that you can query really nicely in Cypher, and get that granular view in a really efficient way.
In total, we have a three node cluster, each of which has eight cores, two terabyte SSDs (which gives us a lot of room to grow), 118 gigabytes of RAM allocated to each of the instances, a 50 gigabyte page cache allocation, and a 15 gigabyte heap. Our system has been so performant that we haven’t needed to tweak these at all, and haven’t had any issues.
We also used causal clustering, which I was hesitant to use at first because I had a background with Neo4j HA at the time, but it worked really well for us:
We have a three core cluster with a write leader, and we divide all the reads between the two followers. This means we could lose a node in our cluster and everything would still work. This has been really stable, and we haven’t had any issues with clustering.
My colleague, who became an expert on backups and causal clustering, built a robust backup solution around causal clustering. This automated process was built into a DCOS app, and the fact that backups can be restored to a new cluster with just a few clicks gives us peace of mind.
We used a technique called dark launching during our deployment process, which I’ve found useful in almost all the Neo4j projects I’ve worked on.
Essentially, you launch your production at full-scale behind the scenes asynchronously, which mimics production access patterns. This allows you to run a series of tests, such as measuring KPIs and performance, without affecting the user-facing site. It also provides the ability to go from dark to “light” – i.e. live to users – with percentage-based scaling, and gives you a built-in ramp-up strategy. This is really useful when you’re replacing an architecture, like we were with Cassandra.
To go to production, we followed a documented rollout plan that my colleague Mike developed for us, which was communicated with our community team beforehand to make sure there were no issues. It was a percentage-based rollout, so we got to 100% after a couple of days and decommissioned our Cassandra cluster a few weeks later.
Wins from Switching to Neo4j
There were several major wins from switching over to Neo4j. Again, the fact that we could measure KPIs and improvements is really helpful for bringing in new technology, because you’re able to show metrics such as the following:
- Our human maintenance hours are down well over 300% with Neo4j, so our ops team loves it. They were having to babysit the old cluster, but they’ve barely touched this one.
- It only requires 1/1000 of the storage, with 50 gigabytes in our new system versus 50 terabytes with Cassandra, all because we were able to abandon the fanout model that was required by Cassandra.
- Our new model is much simpler, powered by only three instances instead of 48, which also reduces cost.
- We have better user-facing functionality for free, which I think is one of the huge advantages of graph.
- Because of the graph model we have easy extensibility, and in fact, we’ve already added a new feature, which is exciting.
This is the experience that kicks off the activity feed in our actual app, which is pivotal to the actual experience on Behance:

When a new user signs up, they’re going to see this screen, which asks them to select what we call curated categories, which are developed by our professional curation team. Whatever you select is what you’ll follow on your activity feed. In this example, we’ve selected two categories, clicked next, and arrived at this screen:

This loading screen is actually really important to us, because it represents one of the wins here that we highly optimized. We’ll get to that in a second.
You’ll see the above screen for a certain amount of time, and then you’ll see your activity feed:
Above, I’m following a bunch of curated categories in an infinite scroll system, which actually represents another big win for us.
Below is a chart that shows how long the loading screen is visible in Cassandra vs. Neo4j:

On Cassandra, if you selected any more than three categories to start with, your initial load time into Behance was more than one second. If you selected all 13, which a lot of users do, there was a four second load time on that spinning wheel screen before you’re finally able to use our product. With Neo4j, because we’ve removed the fanout structure, we can send people to the activity feed in well under one second, which represented another huge win for us.
Here’s a graph that shows the above table in a different format:

The x axis shows the actual onboarding time, and you can see when we cut over to the new activity feed implementation. There were lots of spikes with Cassandra, but things remained really consistent once we cut over to Neo4j.
We can now show 1,000 projects per followed category with Neo4j versus 30 with Cassandra. Originally, if we selected one category, I would only be able to scroll through 30 projects. Now if I choose one category, I can can scroll through 1,000 projects. This gives users much more content and a better experience with the app, all because of the dynamic functionality of the graph.
With our new system, we’ve greatly reduced the web overhead of our app by not having to write tons of stuff into Cassandra. Below is a graph of our action broadcast time:

Some of our actions could take up to 30 minutes to broadcast because they were writing literally hundreds of thousands of feed actions per action. With multiple lots of those per day, this tied up a ton of our web worker resources. But once we cut over to Neo4j, the actual resources on web and the time it takes to write an action is really, really fast, and it was far more consistent.
One of my favorite wins is a new feature live on our site right now, which shows new projects from the people you follow in a sub-view of the activity feed. This wasn’t available in our Cassandra-based architecture, but because Neo4j is so flexible, we were able to easily add this feature. It was created by a colleague, Urie, who had never used Neo4j before but was able to create the new feature and get it into production in just a couple of days.
And finally, we get some basic wins simply because of the more normalized model with feed continuity.
With our Cassandra model, we couldn’t delete data the way we wanted to. For example, if a user unfollowed someone, the content of that user would still appear in their feed. Neo4j provided this basic continuity, which might seem like a small win, but it actually represents the low-hanging fruit I mentioned in the beginning of the presentation. It was an optimization we got for free that impressed people right off the bat.
Lessons Learned
Now let’s briefly go through lessons learned that I hope can be applicable outside our specific use case.
Again, comparison metrics between two systems with the same goal are compelling for internal audiences. In terms of finding a way to bring in a new technology, it’s helpful to have someone on your side who’s familiar with the procurement process and can get you set up with an appropriate enterprise contract. Projects that are primed for this type of transformation are those that have been neglected for a long time.
If your company is hesitant to bring in a new tool like a graph database, don’t give up! You need to do a lot of convincing, which is why having selling points is important. And if your company does put you in a position to bring in new tools, hopefully you’re able to take advantage of it.
With all the graph use cases out there, hopefully you can come away with some ideas of how they could be applicable to your work so that you can also take advantage of the new technology.
This brings us to my last point, which is that although I wanted to use Neo4j for this project, I was hesitant to use one of its newest features, causal clustering. I had to be convinced by my colleague Gabe, and I’m glad I did because it worked out really well.
What’s Next?
In the near future, we’re trying to encourage our development team to think about additional benefits of graph that we could incorporate.
For example, we might introduce more granular ways to view activity by appreciated comment, instead of just by projects published. We hope to be able to provide recommendations and collaborative filtering based on activity data, as well as storing actions.
In addition to views, maybe we could add how long you viewed a project. We also want to explore the possibility of incorporating a graph recommendation engine as well.
Share Article


Explore
Related Articles

Top 10 Graph Database Use Cases (With Real-World Case Studies)

Building a Recommendation Engine Using Neo4j Hands-On — Part 2

Building a Recommendation Engine Using Neo4j Hands-On — Part 1
How Apna Built a Better Job Search Experience With Graph Database

London’s Traffic Operations Digital Twin: The 5-Minute Interview With Andy Emmonds