How the GRANDstack Makes Handling Complex Data Easy

Founder, Muddy Boots Code
1 min read
Editor’s Note: This presentation was given by Michael Porter at NODES 2019 in October 2019.
Presentation Summary
GRANDstack is a full-stack framework for building applications with GraphQL, React, Apollo and the Neo4j Database.
In this talk, Michael Porter, Founder of Muddy Boots Code, will talk about how the GRANDstack makes handling complex data easy.
He will explain how data can be modeled easily, like a whiteboard model as a representation of the real world, and elaborate on how CRUD mutations can be automatically created as well as, in case the automated CRUD doesn’t do what you want it to, how to query custom actions via APOC and Cypher easily.
Full Presentation: How the GRANDstack Makes Handling Complex Data Easy
My name is Michael Porter. I’m a coder. I work for a company called Muddy Boots Code, which I founded. We deal with oil and gas mineral ownership and exploration, which is a very relationship-based, very graphy type of business. So we’ve stumbled upon Neo4j and the GRANDstack, and we have been using them ever since.
When you deal with oil and gas, there are a lot of ownerships, and they split along families and people, lease ownership and buy ownership. You have to keep track of those relationships as well as what percentages of those relationships relate to how much oil is coming out of the ground and things of that nature.
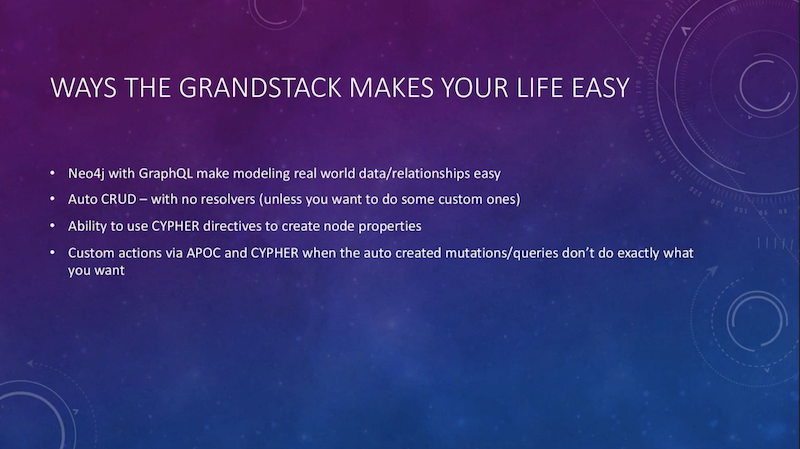
The GRANDstack has helped so much in making our applications for a number of reasons:
- Neo4j and GraphQL make modeling real world data and relationships really really easy. If you can whiteboard it, then you can make it work. You can sit there and draw these relationships out, and then you can express them programmatically so well with Neo4j and GraphQL; that then speeds that process up.
- Something that makes it really easy to work with is that it does all of your auto-creation of your CRUD type mutations. So if you have a well or a piece of land or a user, you’re not wasting a lot of your time writing resolvers in GraphQL, which is one of the worst boilerplate parts of that picture. And then it makes some assumptions about how you want that done based on the GraphQL schema. And if you want to, you’re able to override those.
- The next big part of it is that, because it’s Neo4j- and GraphQL-based, you can then use Cypher, whereas you may not be able to do that in other ways. So you can use custom Cypher directives to add properties to your GraphQL types and make the most of Neo4j
- When you get to the end, if you’re trying to work on your resolvers or maybe if some custom resolvers and stuff are not working for you very well, you can go ahead and write custom mutations or queries fully in APOC and Cypher to create what you want.
Modeling Real-World Data with Ease
In this particular instance, this is oil and gas ownership. And this is a simplified meta graph for how that works:
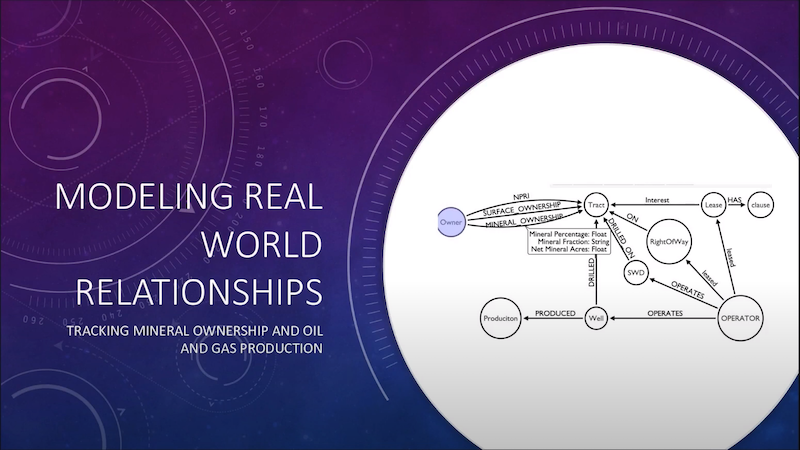
As you can see, there are a ton of different relationships, different types of ownership and different directions of relationships involved. In order to track all of these things and have a really good picture of how that works:
- You need a really good GraphQL schema to understand it and take advantage of it.
- The Neo4j-GraphQL integration allows you to make full use of Neo4j. So that for something that looks like this (image above) where there’s 16 different types of relationships and many nodes and stuff, you can go ahead and scale it out pretty well.
Here is a sample picture of the graph of that information:
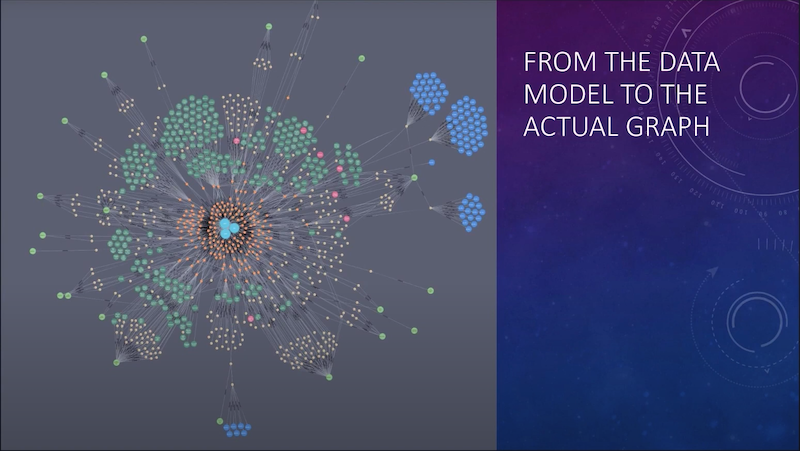
This is more than a thousand nodes representing oil and gas ownership. The lands, the wells drilled on it, the production that occurs, etc. are all shown on this Neo4j graph.
You can see there in the center, there are three owners, and they all have ownership in the tracts, which are the little orange dots, and then it goes out from there, where you have tracts, wells, operators… then the production that comes from those wells.
Because of the way they’re connected, we’re easily able to traverse the graph. So I can start from an owner, work myself all the way across to production, and then take those fractions and eventually get an actual picture of, say, what these people own or what they’re owed based on their production.
This is kind of a smaller picture of just the ownership in the graph:
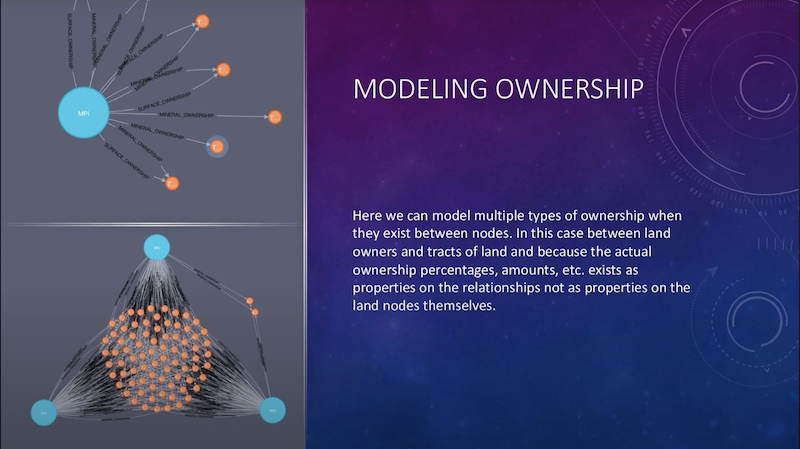
And we can see here, there are three principal owners. There are multiple types of ownership in these tracts of land, such as surface ownership, mineral ownership, non-participating royalty ownership.
Because of the way Neo4j works, we’re able to place those different relationships between the owners and their tracts, and then place on the relationships, the properties that actually represent the amount of ownerships and things of that nature.
At that point, we can go ahead and very easily do aggregations and averages, because you can go from one owner out to all of these tracts and then work your way backwards from it and across. The tract is essentially the center of the graph. It’s the centrality and everything else comes towards it. So it’s very easy to model.
Cypher Directives to Create Node Properties
With GRANDstack, you can add Cypher directives onto your nodes. These Cypher directives allow you to write the Neo4j Cypher query language just like you would if you were working on the Neo4j Desktop or anything else. You can write a Cypher directive that affects a particular node in a database.
So here we’re looking at an owner who’s got a couple properties:
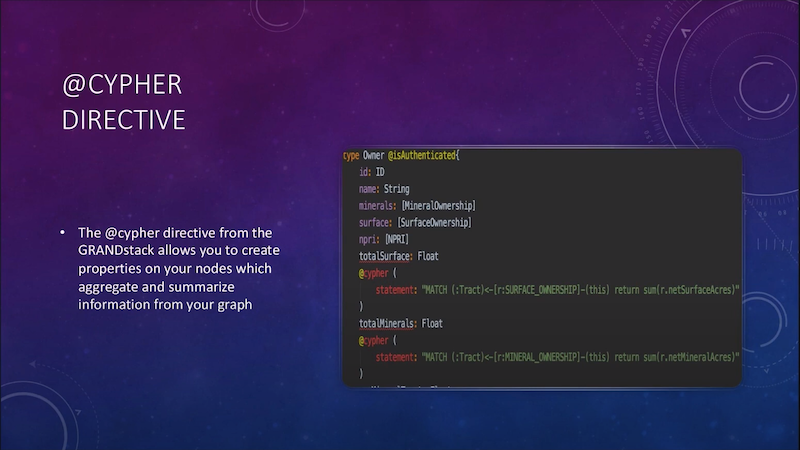
There’s an array of mineral ownership, which is actually a type of relationship, and so it’s got its own properties in there. Same thing with surface and NPRI ownerships.
So then I can place a property on a node, like what total surface and total minerals a track has. That, again, is a Cypher statement that returns just kind of like an enum type, a float or a string.
And so the data is already in my graph now in that type, and when I query the dataset I don’t have to do any extra special magic on the front-end or do anything else. It goes directly to the type.
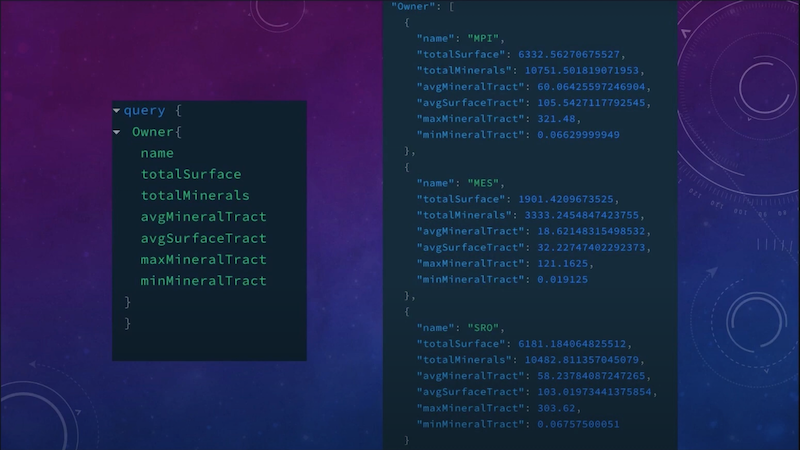
For those of you familiar with the graphical playground, on the left is a simple query; we’ve got owners, the names of the owners, total surface, total minerals, average mineral tract size, max mineral tract size and so on.
On the right, we have our query returned. So that makes it really easy for me on the front-end to build something, where I can give these people a snapshot of their data and tell them what’s going on. So it’s built right in. It’s a single API request. It’s a single pull and a single operation from the database, and it works really nicely.
On this next slide, you’ll see a similar thing, where we traverse the graph:
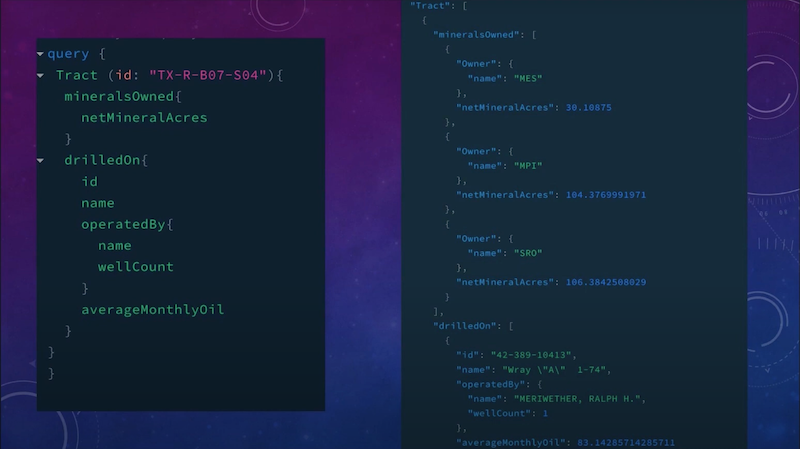
Say I own this huge tract with this ID. I can use GraphQL to go ahead and find out the minerals owned on it – net mineral acres in this particular case. I can see the wells that are drilled on it. I can know who operates them, how many wells that operator operates in total, and then the average monthly oil.
So it actually traverses you across the entire graph, from ownership to tract, all the way to oil in one API pull. The response I get is the minerals owned by the owners here, the well that’s drilled on it, again the operator, their well count and the average monthly oil. So it breaks down this entire section of oil and gas ownership, production, exploration, etc. And because of the nature of graphs, GraphQL and the tools available with Neo4j, I’m able to do that in one shot.
Auto CRUD
Another advantage is GRANDstack automatically creates all of your CRUD mutations. For instance, this is a mutation of an AddWellDrilledOn relationship:

So if I’ve got an existing well and an existing tract and I want to create that relationship where the well is drilled on the tract, I can go ahead and use the auto-mutation they’ve created.
But you can see that the return type is the DrilledOnPayload. The actual DrilledOnPayload is an input type with just an ID for the well and just an ID for the tract. It’s not a lot of information. On top of that, that’s a one-time operation.
Let’s say, for instance, I want to add 10 wells drilled on one tract. I’ll need to map through this so I need to take an array of well IDs, map through it and perform 10 different database operations, 10 different API calls to capture this. That’s probably not going to be ideal in a lot of situations.
Custom Actions via APOC and Cypher
So one of the things the GRANDstack allows you to do is, with Cypher and APOC, to write your very own custom directives and mutations.

What we’re doing here is cloning these clauses. So if you want to drill oil and gas wells, you have to have a lease. And you’ll have many, many clauses. A lot of times they’ll be repeated over and over and over for sections of land, and so it’s not any fun to copy and paste.
In this particular mutation, all I need is a lease ID, an array of clause IDs. And then I can return the lease; I can specify exactly what I want to get back.
Once these clauses are added to the lease, when I pull it in that data type, I’ll have the list of new lease clauses. So I have that Cypher statement. We’ll match the lease. And then we’ll unwind, which is essentially a Cypher shorthand for looping through all of the clause IDs. We’ll match them, clone them, set new IDs on them and then finish that up and return the lease.
What that does is it allows you, as somebody who’s using the GRANDstack and somebody who’s working through this stuff, to perform multiple operations in one go. And the best part about it is that if this should fail, this is gonna fail everything. So you’re not gonna have a situation where, say, you were running it 10 times, three or four of those worked and then the rest failed and you would be left with incomplete information. This actually saves you from that and keeps your operations safe.
Conclusion: How the GRANDstack Makes Handling Complex Data Easy
To sum up the GRANDstack, on the front-end, Neo4j and GraphQL are able to represent your data model effortlessly, with React and Apollo acting as your state management. It makes it really easy to deal with complex use cases like this, where you may have something very simple where you don’t have to go past any of the auto generated mutations.
But if you want to, you can go ahead and dig really far into APOC and CYPHER, get granular control of your data and present it the way you want. That’s how the GRANDstack makes handling your complex data easy.
Download your free copy Fullstack GraphQL Applications with GRANDstack – Essential Excerpts.
