Information sharing for enterprise architects at the DHS


22 min read
Editor’s Note: This presentation was given by Jessica Dembe and Patrick Elder at GraphConnect New York in October 2017.
Presentation summary
In this presentation, Jessica Dembe and Patrick Elder provide a look into enterprise architecture at Blackstone Federal and how the introduction of Neo4j automated formerly inefficient processes for the United States Department of Homeland Security (DHS).
Dembe and Elder work for Blackstone Federal, working with the U.S. DHS. The work that they do within the Enterprise Architecture Information Repository (EAIR) is done at the command of Congress.
When asking the question who uses the EAIR, their findings reveal that information within the EAIR is shared between the U.S. Transportation Security Administration (TSA), the U.S. Coast Guard, and U.S. Customs and Border Patrol (CBP).
Before the DHS used Neo4j, manually scanning high volumes of information was a taxing process. A look into the average search reveals how much data is actually contained within the EAIR database. The user had the responsibility to figure out how systems were related to functional activities, investments and other systems.
When Dembe and Elder began reevaluating the process, they found disparate groups of data that would help overarching missions. Because search results within the EAIR are not directly related to a mission, goal or objective, enterprise architects have to make the connections themselves.
These connections have to cover capabilities and activities, data assets and performance measures and goals.
After the team began exploring Neo4j, graph visualizations were an instant hit. The information was easy to understand and the data was easy to access. Neo4j changed everything because users just had to load data into a graph and connections and relationships were instantly revealed.
Because Neo4j automated the entire process of connecting disparate data and finding common denominators in overlapping missions it became an obvious solution.
Full presentation: Information sharing for enterprise architects
Jessica Dembe: My name is Jessica Dembe. I am a front-end web developer. I’ve been really fascinated by the data visualization that Neo4j gives.
Patrick Elder: My name is Patrick Elder. I’m the product architect for our program, Enterprise Architecture Information Repository (EAIR). I’ve been with the program for about two years now.
I was intrigued by Neo4j when I saw that it was able to provide some visualization and show relationships. I was able to bring this on and convince our customers that it was worth pursuing. We’re going to tell you our story and how we did this.
Blackstone Federal
Dembe: We work for a company called Blackstone Federal. It’s a division within Blackstone Technology Group, with three subdivisions: Federal, Staffing and Financial Services.
Our branch focuses on delivering for federal clients and product delivery methodology. We have principles of engaging with a customer, building products, measuring for metrics and how to improve, learn and build for future best practices.
Elder: As federal contractors, we work for the U.S. Department of Homeland Security (DHS), which was founded in 2002. This was as part of a reaction to some increased awareness about protecting the homeland.
The mission of DHS is to bring together a bunch of disparate component organizations in the United States, such as the Federal Emergency Management Association (FEMA), Transportation Security Administration (TSA), Customs and Border Protection (CBP), Immigrations and Customs Enforcement (ICE), the Coast Guard and the Secret Service.
At headquarters, our mission is to collaborate across all of these component organizations so that they share information. This reduces risk and reduces duplication of effort. Our group sits under the Chief Information Officer, who is under the Chief Technology Officer in the Enterprise Architecture Office at DHS headquarters. That’s where our program resides.
Defining enterprise architecture
Enterprise architecture is a well-defined protocol for conducting enterprise analysis, design, planning and implementation using a comprehensive approach at all times for the successful development and execution of a strategy.
In real life, it’s about the confluence of IT and business processes: What is the business purpose of our organization, and how is IT going to help us do that? That breaks down into these four different areas displayed below.
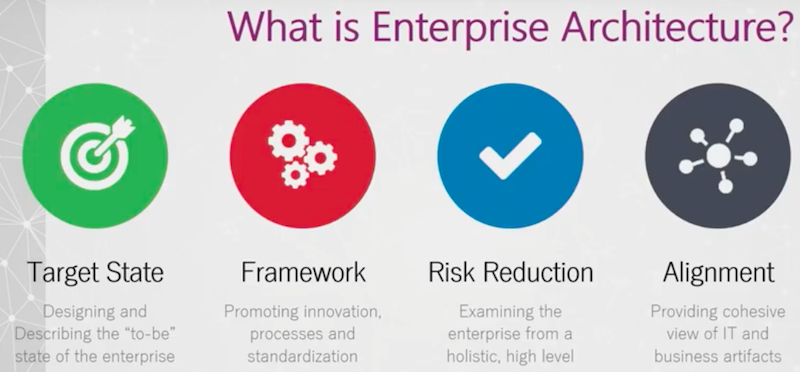
Target state
A target state describes and defines what’s the to-be architecture, answering questions like:
- What is that technology?
- What are the things that we’re trying to do?
- What are we sharing?
- What are we doing individually?
Framework
From a framework perspective, we are trying to develop processes and things that are repeatable and standardized across the organization so that everybody is playing from the same sheet of music whenever possible.
Risk reduction
In risk reduction, we’re talking about reducing duplication and reducing risk. This is by using those frameworks and doing these same kinds of processes at a high level.
Alignment
Lastly, the alignment piece. This is the part where we are starting to tie together those different pieces of the organization:
- So what is the mission of the organization?
- What are the capabilities that it serves?
- How is it funded?
- What IT is it using?
- What systems are used in this stuff?
- What programs are doing these things?
Within the alignment portion is where Neo4j really came in for us. (More on that below!)
Enterprise architecture information repository (EAIR)
Dembe: Here’s a little information about the Enterprise Architecture Information Repository.
The EAIR has been going strong for the past seven years. It started off as a Microsoft Access database on someone’s laptop. He knew the system very well, and he was able to track it.
However, it wasn’t really available to the public.
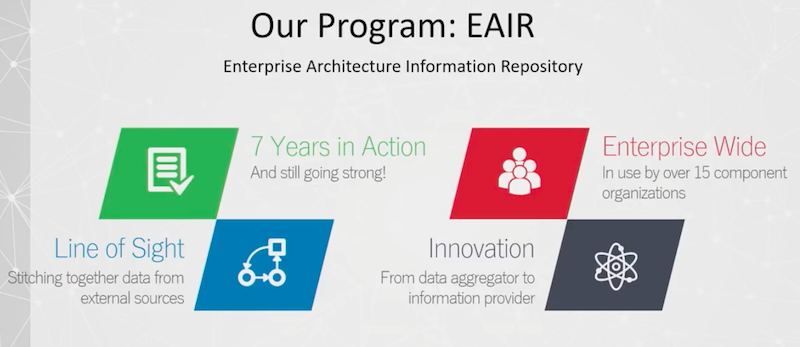
Elder: From that, the EAIR grew and started answering some data calls from Congress. Then all of the sudden the Department of Homeland Security realized that they might need an enterprise system for this. Now this system has grown to be the CIOs’ official line-of-sight data warehouse. So all the reporting that comes out of DHS to Congress – or any external organization – comes from this program.
As the data warehouse for the Chief Information Officer, you can imagine that there are a lot of data sources we have to piece together and have people understand.
The information we are looking at is pieced together via relational databases. Some of these are just direct connections to relational databases. In other cases, we’re hitting web services. In some cases, we’re getting flat files that could be CSV or XML.
There are a lot of different ways that we’re collecting data and putting this together. Not only that, we are the integration point for all the offices within the Chief Information Officer, and for all those components across DHS as well.
Dembe: With those components, we’re in use by over 15 different component organizations within DHS. As you can imagine, it gets confusing. We are using different components and different sources. How do we make sense of it all?
Elder: One of the things that has been a real challenge for us – and for DHS as a whole – is that all of these component organizations have a very diverse mission. TSA cares about transportation security; they could care less about emergency management. The United States Coast Guard cares about protecting the waters; they don’t really care about Customs and Border Protection.
However, all of these departments have an overarching common mission. We’re ensuring all of the data that is shared, and we’re reusing or repurposing as much of that data as possible.
Exploring Neo4j
Dembe: One thing that the EAIR does very well is that, we’ve been able to aggregate data for the past seven years with Neo4j.
We have learned how to connect those lines with data, and we are now seeking to align ourselves as not just a data aggregator, but as an information provider for all components across DHS.
Elder: One of the things that EAIR is known for is the term “line of sight.” We use that a lot to talk about what we have. This is really showing how all these things that are within the organization are related. We are always thinking about how all these disparate component pieces of data are related to each other and how we can show that within our application.
Who uses the EAIR?
Dembe: Who uses the Enterprise Architecture Information Repository?
Some of our biggest users are not just our enterprise architects, they’re managers and decision makers. We have seen other folks use them for “What systems is DHS using?” They are used for products, investments and different aspects of the line of sight.
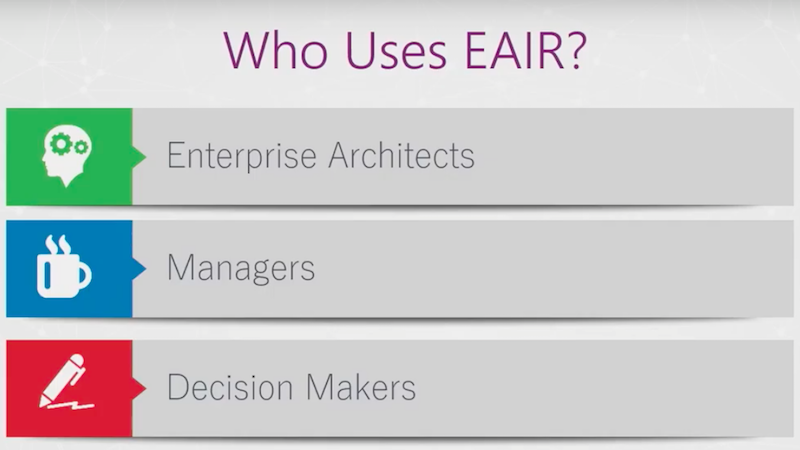
Elder: We’ve got this nebulous decision makers thing listed at the bottom, and a lot of people want to know what that is.
That can be somebody who is deciding, “Are we going to step forward with another technology on our system?” or it’s going to be talking about handing off that data to Congress, or another entity outside of DHS, to make a decision based on the information that we’ve gathered together.
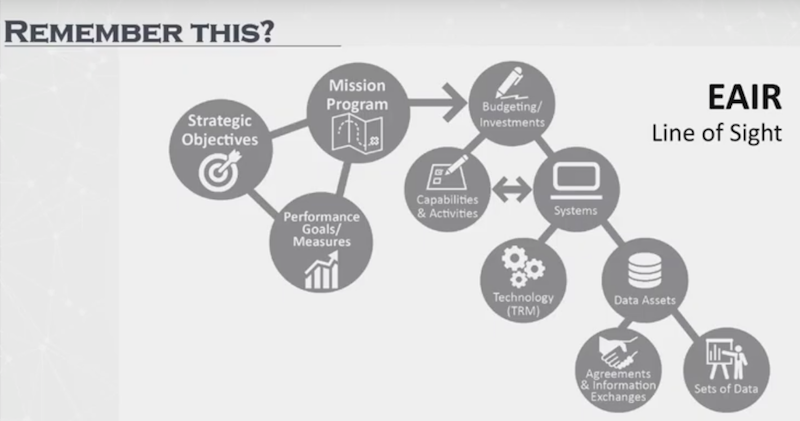
This diagram below represents the line of sight in general terms.

You will recognize that this looks an awful lot like a graph. We’ve got strategic objectives which are the directions that come down from Congress and give us direct orders.
We’ve got the mission and program data. Those say, “This is the mission that you serve, and these are the programs that are going to meet those missions”. Budgeting investments are how this stuff is funded. We are getting this from Congress, and when we ask for money, this is where it’s all documented.
EAIR line of sight: Capabilities and activities
Capabilities and activities are what the systems actually do.
Capabilities and activities could be biometrics and screenings. EAIR would be an example of a system at DHS. We have the technology that supports these systems. That would be the Neo4js, the Oracles, and all the other things that we’ll talk about in our tech stack.
EAIR line of sight: Data assets
Data assets are the containers of data inside of DHS. It may be a database or part of a database.
Whatever the data asset, it has agreements and informational exchanges. When we talk about the interfaces that we have across these different systems, the database is where we’re documenting that stuff.
Then assets also share sets of data. The sets of data contain all these different pieces and parts of data. There could be many within a single data asset.
Performance measures and goals
Performance measures and goals are the things that are going to be evaluated against as we go through each one of our planning sessions. The more accurate and better that we perform on those performance measures, the more likely we are to get the budgeting we request.
EAIR today
Dembe: Currently, our application has an AngularJS application with Oracle APEX on the front-end, and with all our database information stored on an Oracle database. Below is the front page of our application.
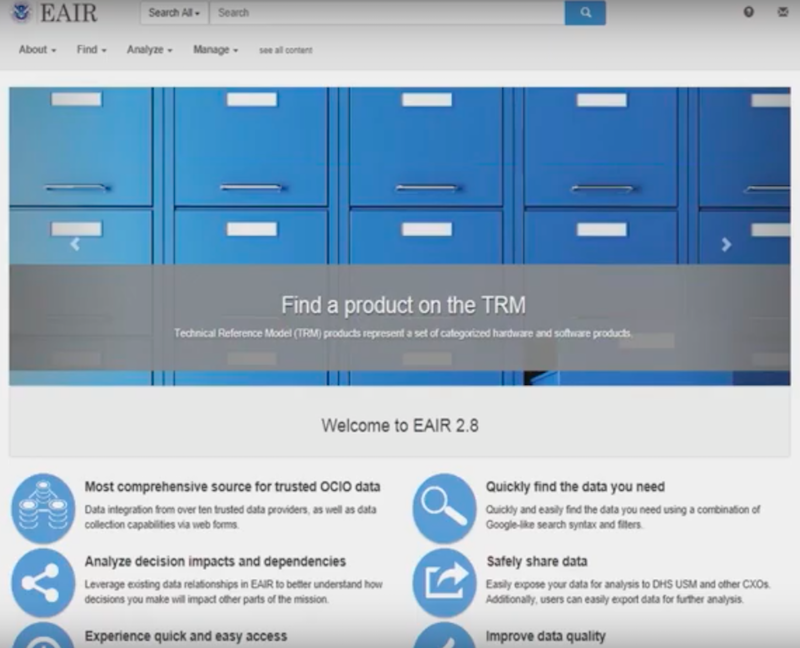
As you see above, this is the front page of our application. Basically, this shows the most comprehensive site information for the OCIO. A user is able to quickly and safely find the data they are looking for.
Application Express
Elder: Just to give some history here, as this program evolved from an Access database into an enterprise system, DHS decided to take advantage of our enterprise license for Oracle Database. With that comes the application called Application Express.
Application Express allows you to very quickly deploy web pages that are based on your database tables. This allows you to manage the data, add up data, modify, delete, and really quickly represent tables and charts.
As we started to modernize our product, we realized that this was a more antiquated way of looking at the data. We wanted to try to add some new kind of look and feel. So that’s where we started to pull in AngularJS. We’re continuing to do that, as we talk about bringing in Neo4j.
A look into the average search
Dembe: I’m going to walk you through a search of a brand new enterprise architect at DHS.
We’re going to look at the EAIR system. This search engine is on Elasticsearch. So it pulls data from our backend and displays on the screen here. Once you click on the system of EAIR, you get this lovely page.
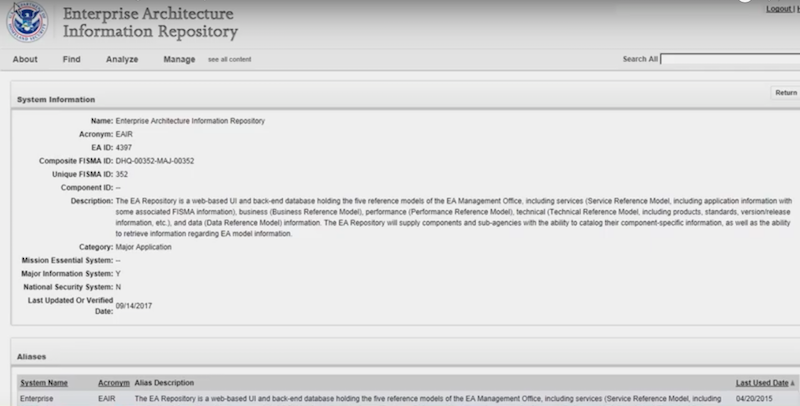
We see system information, we have descriptions and what kind of application it is. Then you keep going about the aliases.
Elder: There’s a tremendous amount of information that we have for each one of these content types, but it’s a lot to digest. If you don’t know exactly what you’re looking for, you’re going to be scrolling a lot. You’ll start to see this associated with lists that represent the way that we tie stuff together, and the way that it is represented.
Dembe: Below is an example of the amount of information our searches yield.
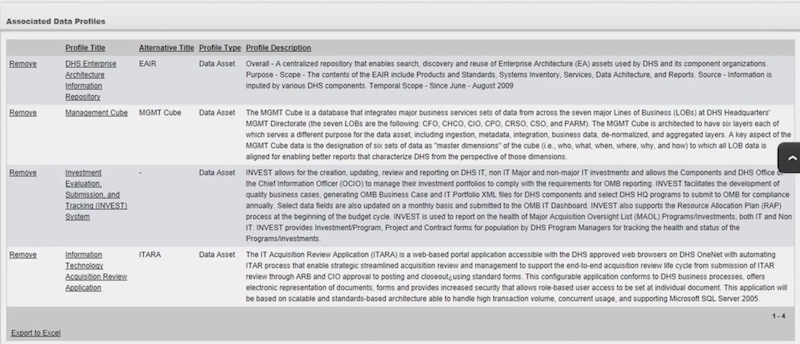
You’ll see here associated function areas, segments and functional activities, investments, child systems and data profiles.
Would anyone remember what they just saw on that screen? No. That’s why we thought about this information, and we asked, “What does this mean for enterprise architects?”
First, it means the user is responsible for figuring out how systems are related to functional activities, investments and other systems. That is a lot of scrolling you have to do. Then you have to be the one to connect the information. That’s not really effective.
Elder: Additionally, this is mainly a search and discovery tool. There’s not a ton of analysis that’s happening on its front-end. The onus is really on the user to go in, do the analysis, and truly search for the thing that they’re looking for.
You can imagine, when you see these pages, there are links everywhere. I can get more information about the related entities, but then I’m jumping into another page. Now I can’t remember where I was, or how I started to get there.
As you’re doing this exploration, there’s a different kind of analysis happening. There’s a lot of data here that’s really untapped, and these are the things that we’re trying to evolve as we add Neo4j to our stack.
User responsibility
Dembe: The next important tool is the user responsibility for understanding how systems support the capabilities and activities of DHS.
Elder: All of the content areas are related. We could just as easily be talking about investments instead of systems here, or products instead of systems. All these things have those inter-relations that the user has to connect on their own.
We can click through all that stuff, but it’s a situation where you’re jumping from page to page. You don’t really have that lineage that you might get from a graph.
Dembe: Finally, the user must comprehend how systems meet DHS’s current and future goals and objectives. A lot of the analysis and the onus is on the enterprise architect, or the manager, or the decision maker, to figure out how everything is aligned, and if we are aligning to the goals and objectives properly.
Elder: This is a great example of being two-degrees-of-separation away from those direct relationships that we saw. Systems are not directly related to a mission, goal or objective. It is through the mission that they support, the investment that they are funded by, or the capability and activity that they do that they are related.
Imagine trying to do this in your mind as you’re clicking through all this text and remembering which thing you clicked on to get where you are now. Eventually you would ask yourself, “Okay, so what thing does this support after all?”
How Neo4j changed everything
From here, when we started looking at Neo4j, we saw graph visualizations show up, and it was a hit for me.
We had had another product on our stack that was a modeling tool – it was an enterprise architecture modeling tool – and it was supposed to take all of the data that we had in EAIR and be able to present architecture diagrams for the enterprise architects.
That sounds like a great idea. They all wanted to use it, but they couldn’t. It was too difficult to use. We couldn’t figure out how to load the data, and they couldn’t figure out how to query their architecture diagrams. That’s a major problem.
When I saw the Neo4j interface, I said, “Wow, this is easy. I can add the data very easily, and I can get something that at least shows the stuff related to each other right out of the box. We don’t have to do anything extra except load the data.”
What we decided to do was bring this to our client and say, “Hey, do you think this is something that your enterprise architects might like?” And they almost jumped out of their chair, “Yeah. We think this is worth showing to people.”
In June, we started to develop a prototype. We reached a point where we felt pretty good about what we had. We wanted to give it a shot. We had the enterprise architects’ collaboration forum, where all the enterprise architects from across DHS, all the components, all the folks that are supporting them, and even a couple of other agencies were guests on this one.
We showed them the Neo4j interface, and they loved it. They wanted it the next day.
Of course, we had to slow things down because we can’t cut everybody loose without trying to explain Cypher and all that good stuff. It did, however, give us enough momentum to try to add that to our stack.
The solution
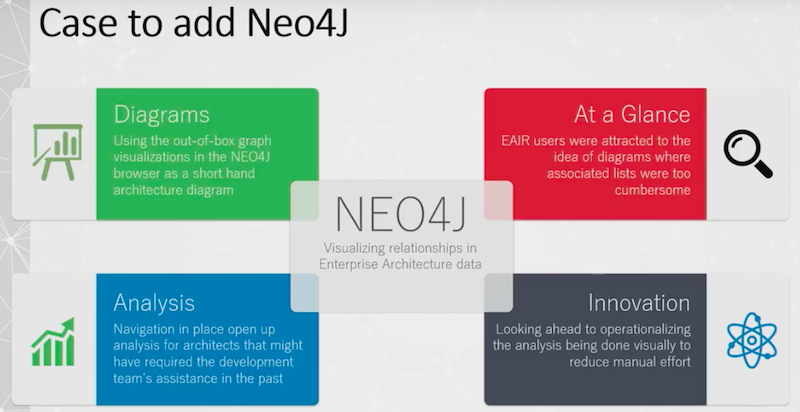
This is the case that we came up with.
The diagram piece was huge for us. That’s something that we just needed to be able to show how all this stuff’s related in one quick look. The at-a-glance thing was key. We wanted to make sure that you get all the details for the associated lists if you want. However, if I want just a little bit higher level than that, I can see it, and I don’t have to do a lot of reading.
The next piece was the analysis part.
We didn’t even know what analysis to develop for our customers because they’ve never had the opportunity to ask these questions of us yet. We are trying to see as they walk through this. Then they started clicking through to see all these different networks and how they’re all tied together. We told them to tell us what you want to know so that we can automate that and deliver it to you.
Our innovation was last.
This was something that we thought was going to be a huge thing. We were bringing in another tool. We found another suite that could really augment what we’ve already done without necessarily replacing anything that we’ve already done.
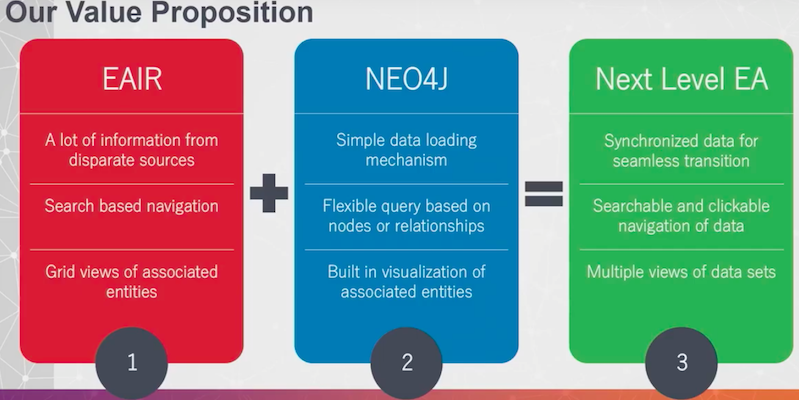
Dembe: We had a collaboration forum to discuss our value proposition on how EAIR and Neo4j can bring us to next-level EA.
Here is a run through of our value proposition when onboarding Neo4j.
Elder: From there we made a checklist. Within EAIR, we’re doing a lot of integration from disparate sources. That’s not broken. We still need to do that.
We have a search-based navigation. Search is used by almost all of our users. Eighty-five percent of our hits are searches, and that’s good, we want to keep that. We still want to be able to search and discover information about the enterprise, but we need to add more.
Then we’ve got a lot of detailed information. This is still important. We want to make sure there are other ways to do this to give people options.
Not everybody analyzes data the same way. By bringing in Neo4j, we had a simple data-loading mechanism. We wouldn’t be worried about having a heavyweight data load process to sync up the data between Neo4j and our existing database.
We have a flexible query interface that we could use, based on nodes or relationships. So we could actually start thinking about this data in a totally different way.
Finally we have the built-in data visualization. That was something that jumped out, but then we started to think about how we could integrate that into the EAIR tool so that it’s a seamless interface for our users.
With those ideas in mind, we want to bring in synchronized data that goes across the two databases that’s available in one place. We wanted to have searchable and clickable navigation of data that wouldn’t necessarily be a page jump, but really just allow you to navigate within place, and lastly, multiple views of the datasets. So if I want to look at the list values, I am absolutely able to do that. If I want to look at it as a diagram, I can do that too.
Dembe: Looking back at our line of sight. We were able to structure our database and investigate those relationships. This is how we dig into them further, and how the strategic objectives influence the mission programs and the performance goals into the investments for the budget year.
Elder: Because the graph visualization piece was the part that was the most attractive to us, we got to thinking that this would be something we could make very lean. As far as we were concerned, the only things that we really needed to maintain were the names, the acronyms and the relationships.
This is the part that we’re seeing as we go forward. We look to our customers to tell us, “What kinds of things are you asking? What other pieces of information do you need to know while you’re doing this traversal of relationships to get the information out that you want?”
Sample relationships
Dembe: Here are some examples of the relationships.
First we do the search on the activity. If you look at the activity below – the purple circle – you see how this spreads out to the primary activities. There are more primary activities coming from it as blue circles. See how disparate it is.
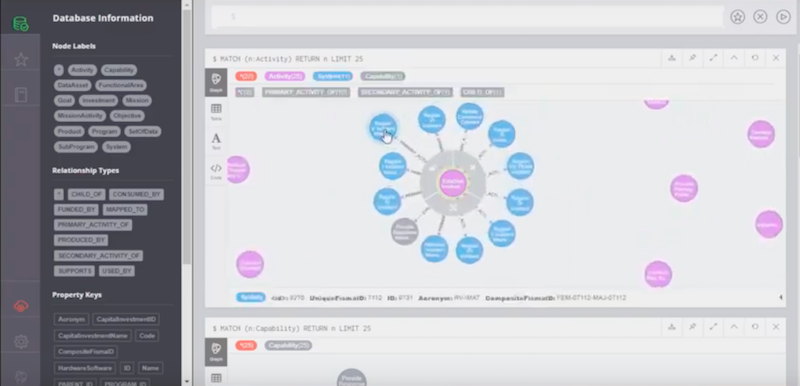
This is the same information we saw in our search results earlier. There it said “associate activity, associate activity, etc.” Instead of clicking into each associate activity, this would provide the mechanism to show you an activity that you’ll be interested in. These dig deeper and further.
Elder: The significance here is that we are looking at the actual things that these systems do. As we are looking at these systems that do the same kinds of activities, we’re asking:
- Are there ways to share those services?
- Are there products that they’re using that do the same thing that we should be sharing licenses with?
- Does one of these systems do better than everybody else?
- Should this feature just be a shared-tenant of what they’re doing? Or are they really that different that they need to be segregated and be their own entities?
That’s what we’re trying to think of and find as we are doing this enterprise architecture effort. As you go across, you start to see the network. That kind of analysis is really what we would be able to pull out.
Dembe: We also have the same thing for capabilities, which get a little more complex. As you see below, grey circles are capabilities.
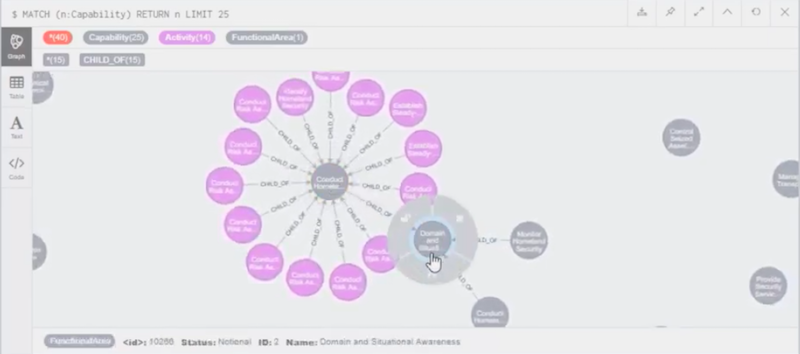
Elder: This hierarchy of capabilities and activities in functional areas is what we have right now.
You start to see how those are all related as you traverse the tree, which is the standard navigation represented in the system now. Think of Windows Explorer or something like that. This allows something that’s a little bit more visual, and you collapse and expand nodes depending on what you’re looking for.
Dembe: We have a similar example for functional area and goals. I especially want to show you the goals because now we are mixing in the missions with the goals and objectives. These tree nodes traverse each other as you see below.
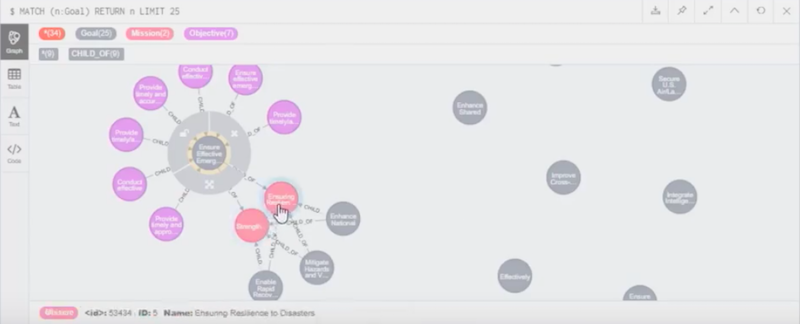
Elder: This is a good example of the extra degree of separation that we weren’t able to represent in the original system by just having the one degree away. By having this explorability and showing those different depths of relationships we created something totally new that hasn’t really been tapped by our clients yet.
Conclusion
With Neo4j now, we use D3.js to visualize each representation on every page. Navigation is in place to help the users decide what they want to see and what they wouldn’t want to see, and most importantly, for the user to easily trace relationships.
We’d like to continue to leverage open source technologies – including Neo4j – and all that it has to offer, and to transform ourselves from an information aggregator to an information provider.
Share Article


Explore
Related Articles


From data chaos to clarity: How connected data can improve US government decision-making
Bolster your cybersecurity by visualizing attack graphs with Neo4j & G.V()

The most powerful fraud prevention tool for federal agencies: Graph technology
