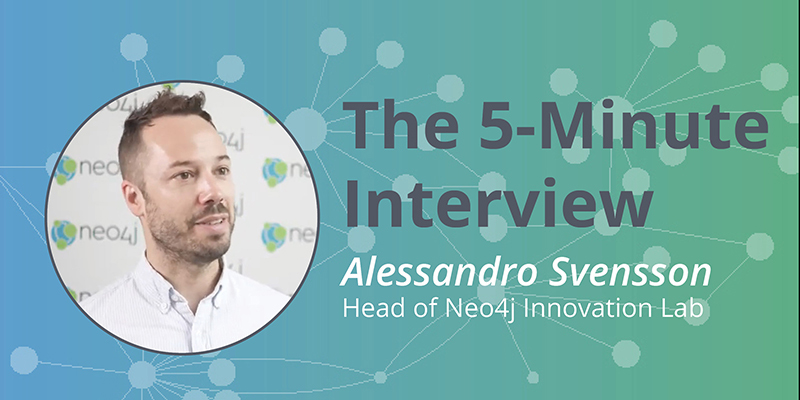
Innovate In Less Than a Week: 5-Minute Interview with Alessandro Svensson

Senior Manager, Content, Neo4j
5 min read

“The feedback we receive from participants is that together we accomplish an impressive amount of work in just a week, even on projects that they’ve been thinking about, working on, and POC’ing for years,” said Alessandro Svensson, head of Innovation Labs at Neo4j.
In this week’s five-minute interview (conducted at GraphTour San Francisco 2019), we spoke with Alessandro Svensson about the Neo4j Innovation Lab’s work accelerating companies’ time to validate Neo4j and the way graph databases serve many use cases within enterprises.
Tell me about the Neo4j Innovation Lab.
Alessandro Svensson: The Neo4j Innovation Lab is run by a global team. At Neo4j, that consists of facilitators, strategists, field engineers and Neo4j data scientists, as well as designers who conduct Applied Innovation workshops with customers and prospects. We’ve been doing this for about two years now; we did our first pilot project in June 2017.
We have done workshops for 30 to 40 projects so far with customers from all industries, mainly Fortune 500 customers. Typically, we work with their innovation team to accelerate their time to validate Neo4j – but also to explore the value proposition of connected data and graphs within their enterprise.
We work with customers who know that graphs are of strategic significance and that it’s important for them to connect their data. But often they’re not entirely sure about what their use case is.
What kinds of challenges do customers face?
Svensson: With all transformation and innovation projects, the biggest hurdle, especially in these technologically disruptive times, is the time to market. You have to validate your technology choices quickly.
Historically at Neo4j, we’ve seen that legacy companies, in particular, take a long time to validate the technology. It can take nine to 18 months just to understand if graphs are a good fit.
In part, that’s because connected data also implies that you have to work across silos, which is a big cultural challenge for these customers.
What we wanted to do with the Innovation Lab is bring not only our technology but also help customers identify and prototype around use cases to shorten that validation span. So the Innovation Lab’s purpose from the beginning has been to accelerate the process by which they validate their use cases.
How does design thinking play a role in your workshops?
Svensson: Our methodology relies heavily on design thinking, which is a great fit because graphs handle complexity in a very fast and comprehensive way.
What we do with our team is bring facilitation and design thinking, in combination with field engineering and data science. It’s not really our job to define the use case; we’re there to facilitate and be the graph experts, to help the customer’s innovation team bring their domain expertise and craft the use case together.
All the use cases are interesting, and we’ve been all over the map – from advanced customer journey use cases to working with energy companies on their supply chain.
When we go in with a cross-functional team and the customer brings their innovation team (which is also, by design, cross-functional), the interesting thing is the pace at which we can explore and discover potential graph use cases at their company. And we do this in a sprint format.
What has been the response from participants?
Svensson: The feedback we receive from participants is that together with them we accomplish an impressive amount of work in just a week, even on projects that they’ve been thinking about, working on and POC’ing for years.
That’s really the core here: To combine a methodology that is a natural fit to deal with the complexities within an organization and combine that with graphs, which is just natural from a technical perspective.
What have been some of your most interesting or surprising results?
Svensson: I’m always amazed at what is produced in three-and-a-half days when we bring different perspectives together.
In our case, we bring strategy, design, field engineers and data science, working with business units and technical expertise from the customer side. With a highly curated process, it’s incredible how much we are able to produce, all the way from thinking about the value proposition for a use case to actual prototyping.
In all of the 30 or so engagements that I’ve been involved with, I’ve always been amazed on the last day. It’s like, wow, how did we accomplish all of this in such a condensed period of time? But that’s also a tribute to the methodology. It’s really an initial validation phase that speeds up things in an impressive way.
And the workshops are a great fit for graph technology. Our data models and the graph itself are powerful and also intuitive for everyone to understand. It’s easy to look at a graph and see the business problem and how everything is connected within an enterprise, which is very complicated if you don’t have that visibility.
What do you think is in store for the future of graphs?
Svensson: There’s a lot in store. In the past 10 years, especially in the consumer web, every company that has had a disruptive effect on their industries has graphs at the core. There’s a ton of evidence for using graphs. We can just look at the Googles of the world; that’s a really good case to study.
Being able to leverage the connections in your data is extremely disruptive. And the competitive advantage of the connectedness of your data and the network effects are extremely powerful.
But then from an innovation perspective, I think it’s interesting because since graph technology itself is there to connect things, it lends itself to addressing the cultural problems that especially large enterprises face with innovation. After all, if the data is disparate and in silos, that means the company itself will be disparate and in silos.
And a lot of the power comes from connecting all of the knowledge at a company, or the data to data from different silos and areas of the company to build better products and services.
With graph technology, we don’t shy away from complexity; it’s actually where we thrive. Graphs are not great for flat data, but they are awesome for connected data. So when you have connected data use cases, you’re going to operate at a deficit if you don’t adopt not only this technology but also the mindset.
Where should companies look to find their next use case?
Svensson: There’s a concept in innovation referred to as “the adjacent possible.” Let’s say you have a network of things and you add a new data source; perhaps you have customer and product data and then you add transactions to that. Almost intuitively, you see new opportunities, new use cases, by just adding things on.
For your next innovation, the lowest hanging fruit would be to look at the adjacent possible to what you’re already doing. And that’s also a natural fit for graphs. The data modeling itself invites that. If you as a business user or as a strategist can tap into that way of thinking about a use case or your data, it’s a very good, creative space to find other opportunities as well.


