
Introducing Neo4j Bloom: Graph Data Visualization for Everyone

Vice President, Product Management, User Tools and Developer Experience
4 min read

Today at GraphTour San Francisco, CEO of Neo4j, Inc. Emil Eifrem announced the arrival of an entirely new product being added to the Neo4j Graph Platform: Neo4j Bloom.
Neo4j Bloom is a breakthrough graph communication and data visualization product that allows graph novices and experts alike the ability to communicate and share their work with peers, managers and executives – no matter their technical level.
Its illustrative, codeless search-to-storyboard design makes it the ideal interface for non-technical project participants to share in the innovative work of their graph analytics and development teams.
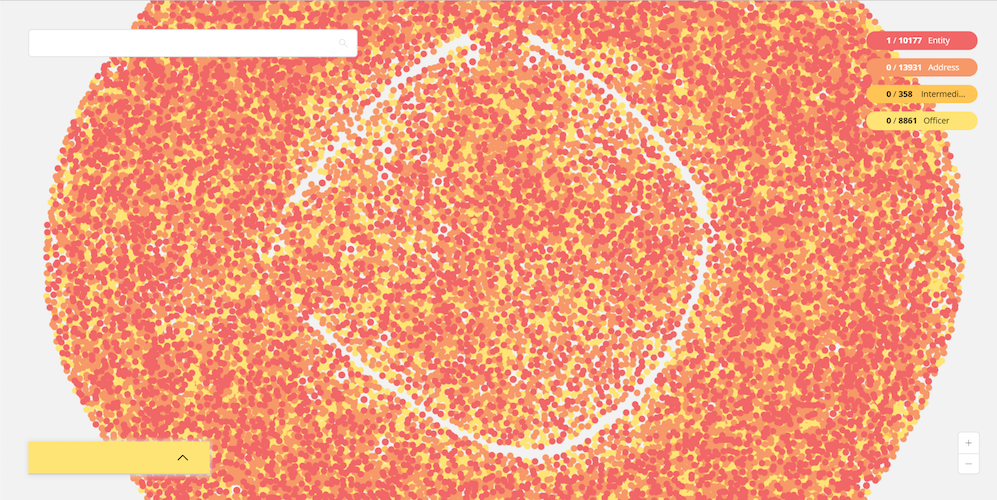
GPU-accelerated rendering scales to over 100,000 nodes and relationships at once in Neo4j Bloom.
Why Neo4j Bloom
Neo4j Bloom is designed to help traditional Neo4j users communicate with their non-technical peers in a simple manner. Bloom reveals and explains the concepts of data connectedness for people who may not naturally think that way.
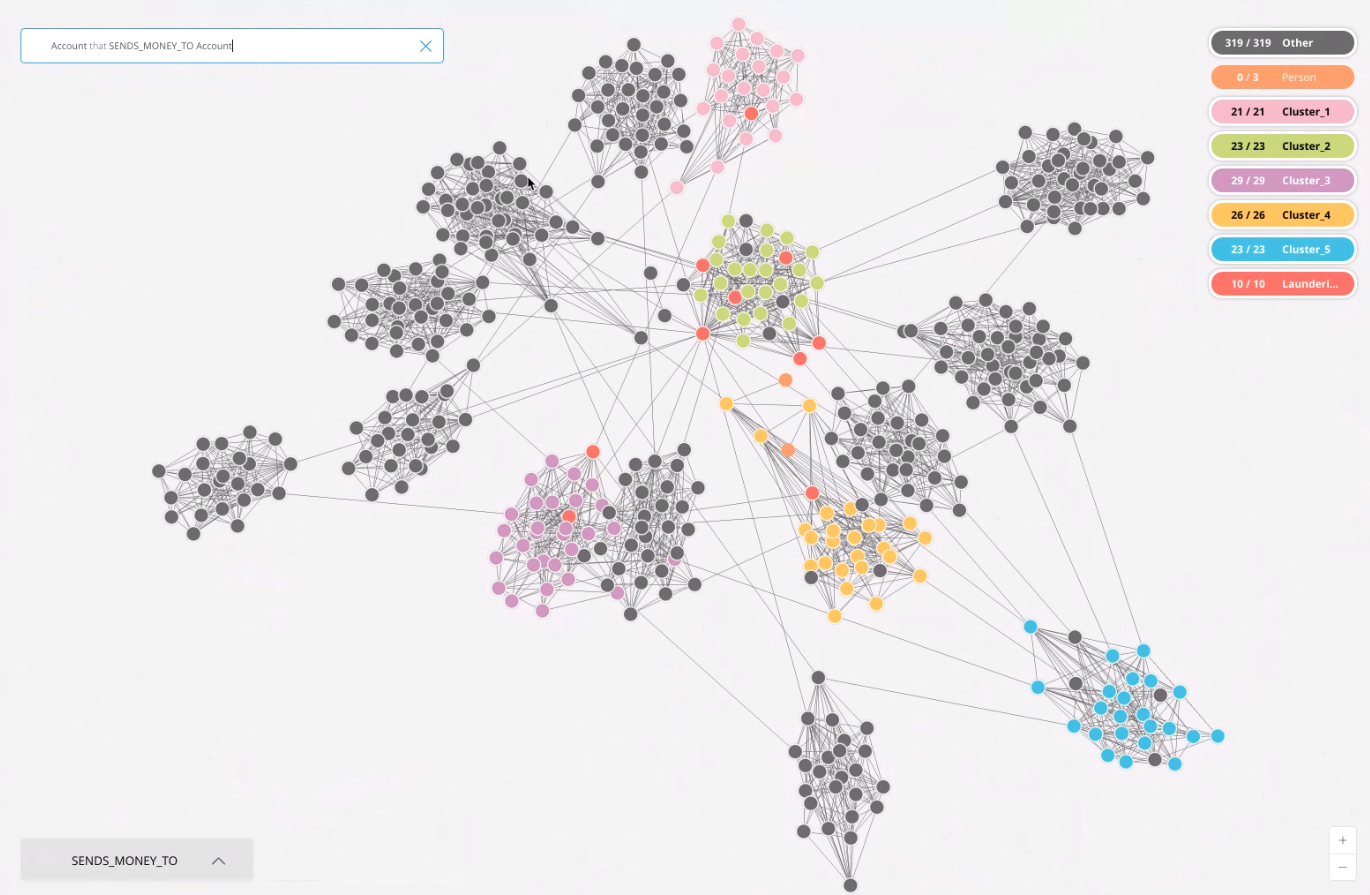
Bloom quickly visualizes related node clusters.
Bloom’s goal is to accelerate the occurances of “graph epiphanies” – the realizations around how people, data, devices, systems and activities throughout the enterprise are all connected – regardless of technical skill.
Neo4j Bloom Reveals Connections
As with all graph visualization tools, Neo4j Bloom reveals non-obvious connections and materializes abstract graph ideas and concepts in a tangible way that users can see and navigate.
Bloom visually reveals the value of data relationships and identifies connectedness paths between interesting clusters and nodes. These situations often include:
- Identifying the relationship (or hidden path) between individuals
- Connecting people to activities, locations, compaines, devices and other objects
- Demonstrating to management the innovative impact of graphs
- Illustrating the context and paths of graph designs and Cypher queries
What Neo4j Bloom Does
On a high level, Bloom is a codeless search- and keyword-based graph visualization tool. It is fully connected to the Neo4j Graph Platform and allows for both the navigation and editing of graph datasets stored in the Neo4j graph database.
Bloom is a full-featured graph visualizer and editor.
What You See on First Launch
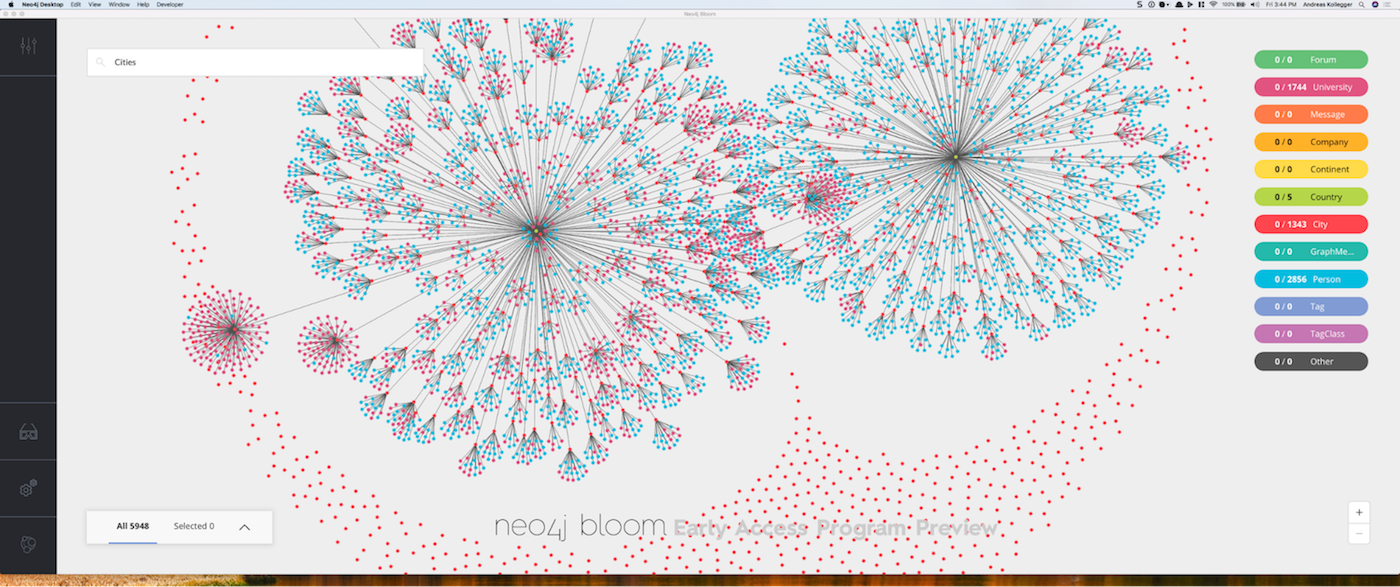
When you first launch Neo4j Bloom, you’re presented with a template that offers a pre-built or auto-generated graph schema that defines the initial perspective for your dataset.
Auto-generated templates attempt to identify node categories by reading the data and identifying what makes the most sense. As a result, the template defines the node category color scheme, search phrase suggestions and node icons.
This diagram represents the users’ first Bloom data visualization.
Additional Features of Neo4j Bloom
Bloom gives you the ability to:
- Inspect the animated graph by panning and zooming across the visible domain
- Snapshot scenes using a screen capture tool and paste to publish
- Select a node and toggle to understand properties and adjacent nodes based on its relationships
- Edit nodes, relationships and properties
- Pick a template and view the metadata perspective of that template against your data
- Initiate queries within the search box based on suggestions and template phrases
- Advance the scene and choose a new query to execute in the search box
- Save your history including “hints” that inform the illustration so Bloom remembers where you left off
Since Bloom knows your metadata node types, relationships and property values, its search functionality offers suggested search phrases to advise you on the structure of your queries. Bloom search also allows you to apply regex operators and logical operators as search filters in addition to specifying parameter values, such as $nodetype. Finally, you can past Cypher queries directly into search.
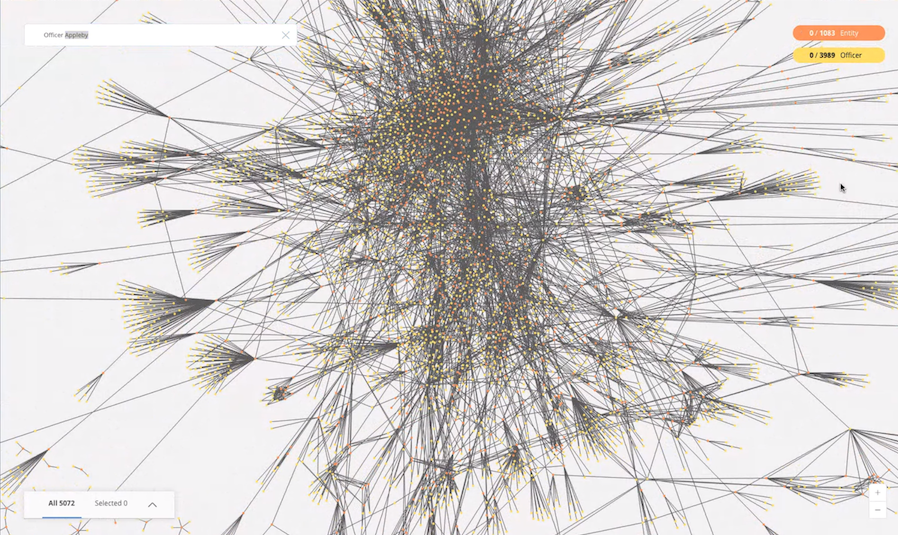
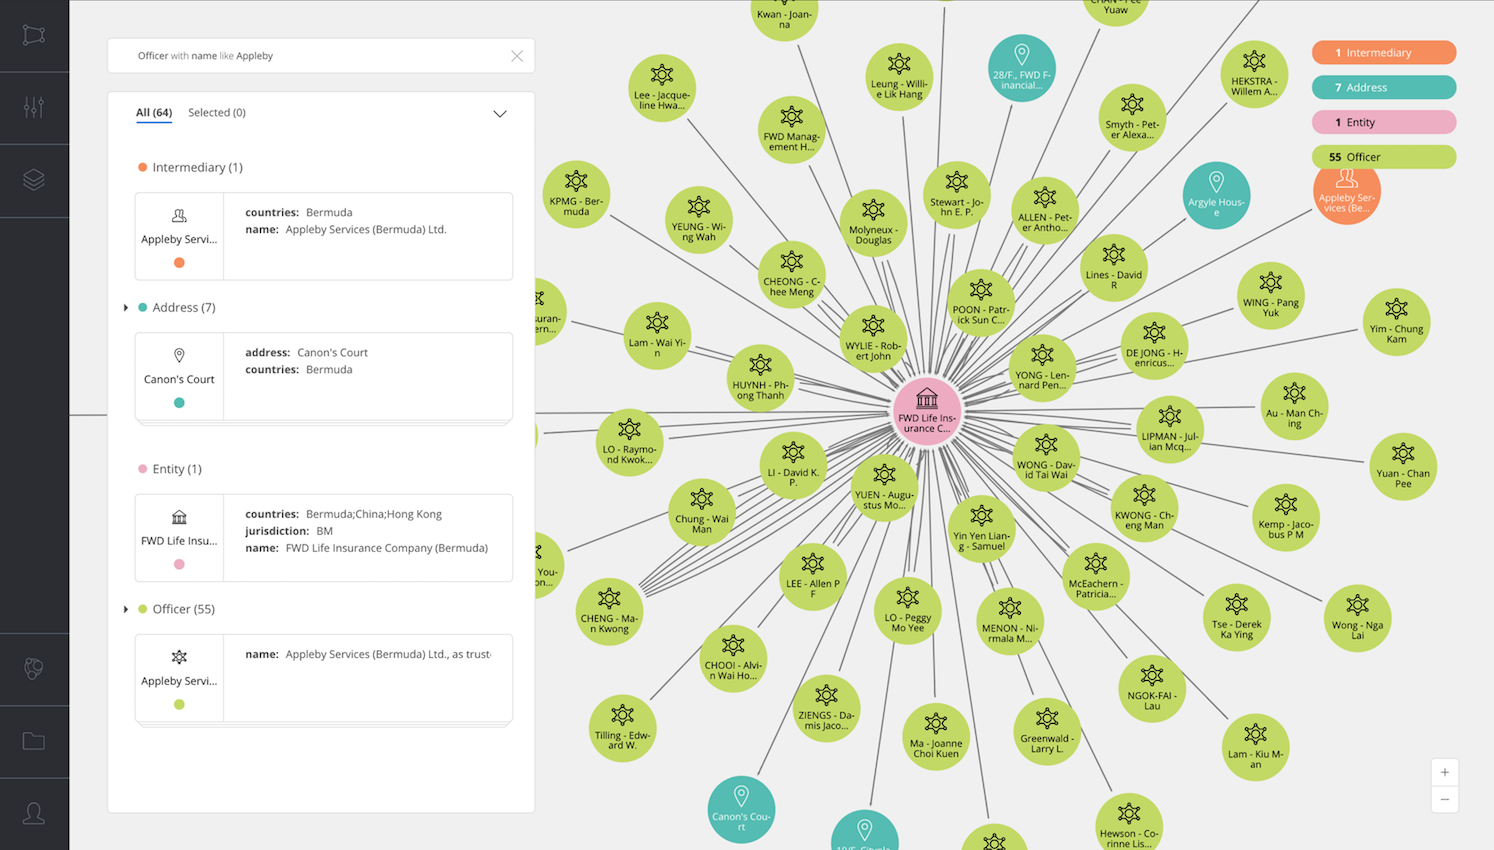
This Bloom data visualization maps the Paradise Papers dataset and shows the connections to the tax sheltering firm Appleby.
Where Neo4j Bloom Fits within the Neo4j Graph Platform
We are very excited to announce the release of Neo4j Bloom today – with a slated release date for June 2018 – but this new product is only a part of the other releases happening across the Neo4j Graph Platform this spring, including Neo4j Database 3.4 (more details coming soon).

Neo4j Bloom is one of the many parts of the Graph Platform being released in Q3 2018.
In order to run Neo4j Bloom, you’ll need to meet the following prerequisites:
- Access to a running instance of Neo4j Enterprise Edition (local or networked)
- A licensed Neo4j Desktop instance
- The Neo4j database to which Bloom connects must be indexed for the data which will be visualized
- A Bloom license attached to that server instance
- An input device (keyboard) supported by the Bloom Dialog Box
Conclusion
The whole Neo4j team is proud to announce the upcoming release of Neo4j Bloom as the first entirely separate product that we’ve produced in years. We believe that graph visualization is the logical next step in realizing the vision that (graphs)-[:ARE]->(everywhere).
We hope you enjoy it.
Grab yourself a free copy of the Graph Databases for Beginners ebook and get an easy-to-understand guide to the basics of graph database technology – no previous background required.
Share Article


Explore
Related Articles

Neo4j Named a 2025 Gartner® Peer Insights™ Customers’ Choice for Cloud Database Management Systems


