Jim Webber with Asurion’s Julie Fisher on her singular path to graph

Chief Scientist, Neo4j
12 min read

At this year’s NODES 2021 closing keynote, Dr. Jim Webber, Neo4j’s Chief Scientist, unearthed some of Neo4j’s most varied and vibrant community members and customers to give them a chance to tell their graph stories. As he said in his intro leading up to this session, “I’ve tried to draw upon a good range of people and topics, and show how the community is really quite a lovely, friendly, nurturing venue for sharing ideas and experience.”
We couldn’t agree more! Here’s your opportunity to check in on some of these showcased stories, whether you missed it the first time or are looking for an inspirational recap.
Up first is Julie Fisher, a Risk Modeling Scientist at Asurion and an avid Neo4j user and community member. We think you’ll enjoy learning how she came upon graphs and the unexpected professional turn that got her there.
Enjoy, and check back here in the coming days for more of Jim Webber’s terrific interviews from this year’s NODES 2021. And if you missed Julie’s talk from NODES 2020 – Not All Graph Visualizations Are Created Equal – you can watch the whole session right here.
Meet Julie Fisher
Jim Webber: I am absolutely thrilled to welcome Julie Fisher as my first guest in this closing keynote of NODES 2021. Now, Julie, you’re no stranger to NODES. You were here at NODES 2020. And in fact, our photographs were next to each other on the NODES 2020 webpage, which was a reflective glory for me. What we learned last year is that you’re working at Asurion and you’re working in risk, and that all seems very terrifying to me. So tell us about that terrifying, anxiety-inducing risk thing that you’re doing.
Julie Fisher: I’m not sure I would call it terrifying. One of my coworkers says we work in cell phone insurance. It’s not a fire, right? And so it is very interesting, ’cause you are protecting people, and their policies, and everything like that. And so, you definitely wanna do a good job, don’t get me wrong. But at the same time, if something breaks, nobody is gonna die, right? So as a risk analyst, we look for a lot of fraud, right? There are a lot of different ways to perpetuate fraud. And one of the things that I’ve been exploring is how do you use graph technology and network theory in order to identify that kind of risk and stop bad actors from gaining financial benefits from other people?
Jim Webber: Very cool. So in the old days, I used to have this idea that you could kind of see rings in fraud, but I’m guessing that’s a very basic view of things, right? And your view seems to be a lot more sophisticated. So what kind of network or graph theory things do you apply to kind of figure out these bad actors?
Julie Fisher: Well, most of what I have been doing is getting graph visualization up. So we have a lot of adjusters that go through [the data]. We’ve got a lot of legacy systems in place that are more like hardcoded manual rules. That has worked really well for us in the past. And we send all of the high-risk claims over to be looked at by individual people. One of the things that I was doing was, not only did I need to look at it, but they benefited greatly from the pilot program we ran about how we visualize these kinds of things for them.
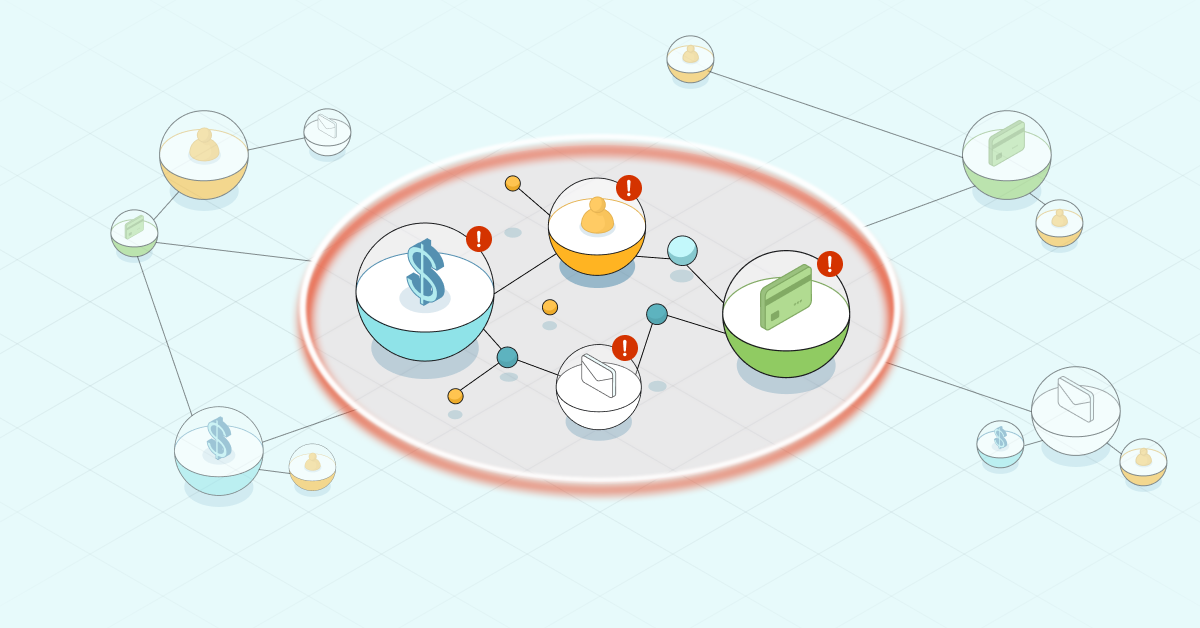
We did find one nice big ring, and it did literally look like a ring. I think it’s in last year’s talk, the visual of it, but it was this nice big ring. But the nice thing about having the adjusters go through line by line is they also identified other kinds of fraud that hadn’t occurred to me, and that we can also use graphs for. So one of those things is they will claim a phone, and never return the old or the broken phone, which isn’t really broken. They’ll assign the old phone up under a new account, and they’ll just keep doing that and opening multiple accounts under the new device that they get and the old devices that they get to keep. And so, you can see these long lines of shipped devices and old devices connecting from account to account – that was interesting as well.
How does graph technology help combat fraud?
Jim Webber: Oh, that’s very cheeky, isn’t it? So in that case then, you’ve effectively got some agents learning patterns, which are fraudulent in your graph. And at the moment you’ve got human experts acting as those agents. Is there a possibility that those human agents could be augmented with software agents? I’m thinking about, kind of, machine learning (ML) agents in that case.
Julie Fisher: Yeah, and that’s one of the directions that we’re going. So last year was a lot about like, how do we actually visualize these things? How do we make it so that we can see the patterns in what we’re trying to find? And this year, I’ve been working on how we model the graph, so that I can programmatically find these kinds of things and new patterns and trends, so that we can then send those over as high-risk claims and expand the amount of known fraud that we have, right? Because in fraud, you’ve got known fraud, unknown fraud, and unknown at all. So there’s probably good actors. There’s definitely bad actors. And then there’s everything in between where you’re just not sure. So if we can expand the known bad actors into that unsure category, that would be a big win for me.
Jim Webber: Yeah, it sounds like an incredible kind of classification problem, right? I think in my mind that’s something that graphs and human intelligence, and software intelligence, could probably help a lot with. So in there, I mean, you said a lot about graphs. You’ve got these fraud rings, you’ve got these kinds of fraud chains and so on. And of course, I think to me and you, and many people in our community, that seems very natural, or at least after a few years of doing graphs it seems very natural. But I can imagine, if you’re similar to me, when you first came to graph, there’s a little bit of a learning curve, right? And how did you come to Neo4j or graphs originally? How did you reach that realization that graphs would be helpful to you?
Julie Fisher: Well, you know what? So I actually was looking at tabular data, so it was in tables, and I would see these patterns – like they would use the same email on five claims and then they would have a different phone number on all five of those claims. So you couldn’t say they have the same email and the same phone number, but if you looked at those phone numbers you could find another five per phone number, right?
And so from that, I was seeing these chains of things and I was like, man, if I could put this in some kind of LinkedIn something – or something like they do with the social media – I bet I could find a lot of fraud. And we had Neo4j, ’cause somebody else apparently had had that same idea. I was like, Neo4j is where I wanna be. I essentially pushed my way into that area, so that we can continue to find fraud using the graph technology.
Julie’s unconventional path to graph
Jim Webber: Oh, that’s fascinating. So I’ve struggled with that myself. When I look at rows of data, I don’t think I’ve worked my brain to kind of see through the matrix, but you could see through the matrix, right? You could see the connection.
Julie Fisher: Well, and I bet you come from a computer engineering background, right? Yes, so I was an English major.
Jim Webber: No way.
Julie Fisher: So, yes. When you come from that computer science engineering background, you’re very used to relational databases, right? Whereas coming from being an English major and writing creative stories during my bachelor years, you kind of look at things a little differently and you’re not as constrained by those things that you’re so used to from when you were getting your bachelor’s degree.
Jim Webber: Oh, that is wonderful. I think one of the nice things about our community is that we do have those axis of diversity in it. I think people like me – the computer scientists – we’re well represented, but there are people from across so many disciplines that graphs are helping and people that are contributing back into graphs in so many disciplines. In fact, a good friend of mine did his PhD in English. In fact, in Elizabethan prose fiction. And the contributions he’s made to the graph community are themselves just astonishing.
Julie Fisher: I was gonna say, has he been using like, natural language processing combined with graph, ’cause that looked like a very fascinating area?
Jim Webber: Absolutely. I see folks working on that even now. It’s such in the APOC world of Neo4j, in the Hume world, in the kind of vendor product world, it’s definitely going there. So since it’s fascinating, it leads me to something that, with a community mindset, I’m very interested in. You came from an English background through the insurance world into Neo4j, and that’s an unusual path to take, if I can use that pun. What would you say to previous you, who was looking at this problem, and how would you influence previous you to say, “Hey, go this way, it’s going to make your world better?”
Words of wisdom she would impart on a young Julie
Julie Fisher: Man, that’s a really good question. I’m not sure how to answer that, because kind of the secure test path that I took led to being able to do all of the things that I do, right? So when I was in college there was no data science. Machine learning was very technical and I wasn’t that interested in math. I’m an English major – not that interested in math. I wasn’t interested in writing computer code for computer code. I write it, because of the interesting things that I can do with it. And so, it wasn’t until you get that co-mingling of analytics, computer science, and math that my interest really comes in. I don’t know that I could’ve gotten involved much earlier than I did, just because of where my interests lie and how I think, right? Because the graph database is still pretty new. How old is Neo4j now?
Jim Webber: Well, accounts vary, but commonly we say it’s about 10 years old, but the truth of it is Emil is older than he looks. And this has been around in one form or another since about 2003. I’m hoping he’s already gone home by this point and he isn’t going to fire me for saying this.
Julie Fisher: Yeah. So, I mean, that’s still pretty recent. And Neo4j I know has matured as it’s grown. And you guys are one of the forefront graph databases out there. It’s hard to say I could’ve gotten involved a whole lot earlier. It would have, of course, been nice to know more about computer science, but at the same time, if I’d come from that background, it would have been harder to get into graphs. So like, I don’t know what kind of advice I could give a past me other than keep your options open.
Jim Webber: Yeah, I mean, it sounds like the advice to past you is patience, because you’re gonna get really stuck into this community.
Julie Fisher: Yes, yes.
Jim Webber: That’s awesome. So let me round off by asking you a more open-ended question. So we’ve seen the stuff that you’ve worked on. Folks do check out Julie’s talk from last year’s NODES if you haven’t. It’s absolutely wonderful. But where do you think the graph tech is going in say, Asurion or in risk, or in fact in general if you can apply so broadly?
On the future of graphs
Julie Fisher: I feel like it’s going the same way that a lot of data science is growing. It’s growing, it’s becoming more mature. It’s being used on more problems. With graph especially, I would like to see it applied more to problems like traffic, right? Traffic feels like one of those natural things, because like, how much traffic can actually go on a single road between your intersections or nodes? And so, that feels like it could help with those.
I just see it expanding into different industries, different domains, and helping wherever it goes, because graphs are everywhere and everything is connected, right? So I mean, really when you can take advantage of that, and I think the dissemination of information about graphs is one of the really important things. Because like you said, it’s a different way of looking at things that a lot of people just do not intuitively understand. The dissemination of that information is going to be huge in the expansion of graphs into all of those different places, and actually being able to use that information, right?
Jim Webber: I think you’re absolutely on the money there, Julie. I think and hope that you’re right.
Julie Fisher: Me too.
Jim Webber: Well, look, I just have to say thank you so much for joining us at NODES today. It’s been wonderful to host you even for these very briefest of chats, around the community.
Julie Fisher: Well, thanks for having me, Jim.
Jim Webber: And I thank you for your time.
Share Article


Explore
Related Articles
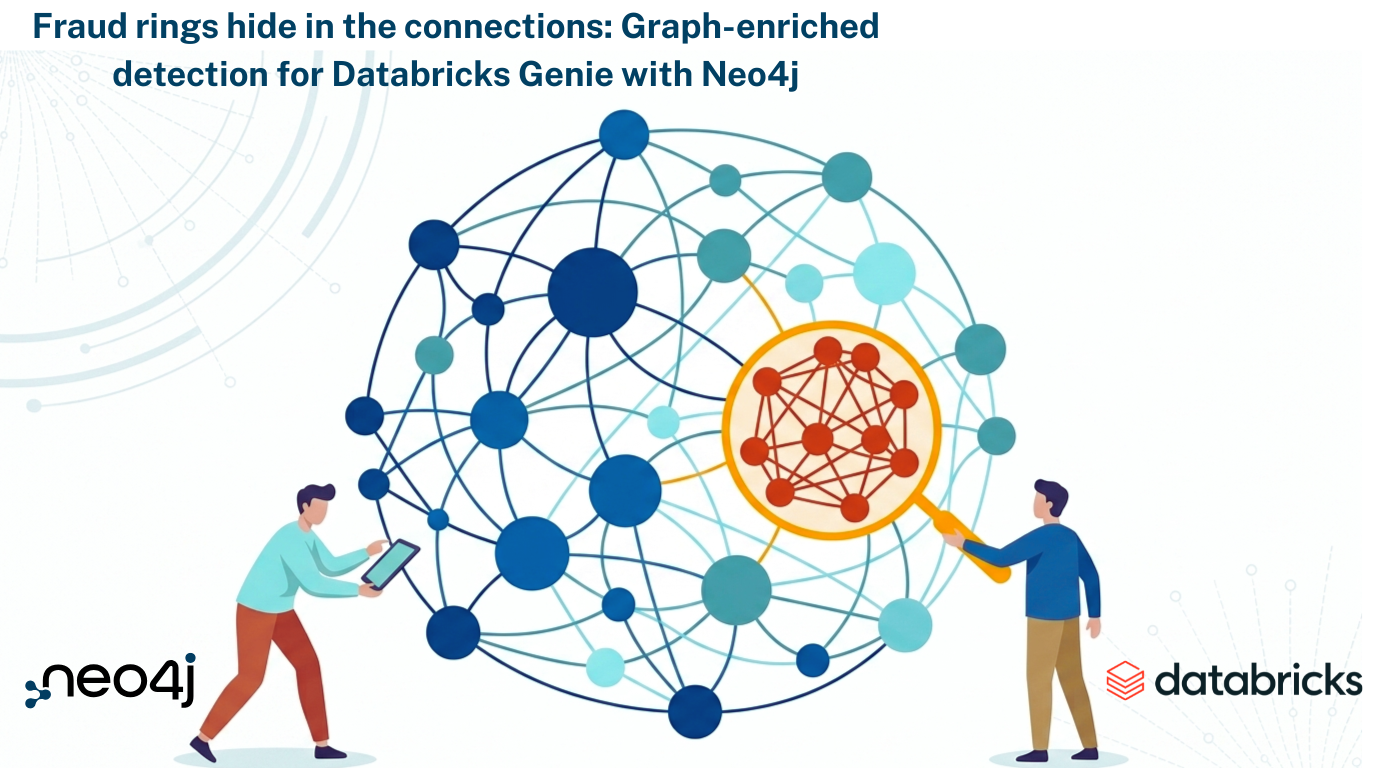
Fraud rings hide in the connections: Graph-Enriched Detection for Databricks Genie with Neo4j
Detect fraud faster with a transaction graph