Our Journey to Self-Discovery: Synthesizing 30 Years of Data Pipelines With Knowledge Graphs

Sr. Program Director, Knowledge Graphs
10 min read

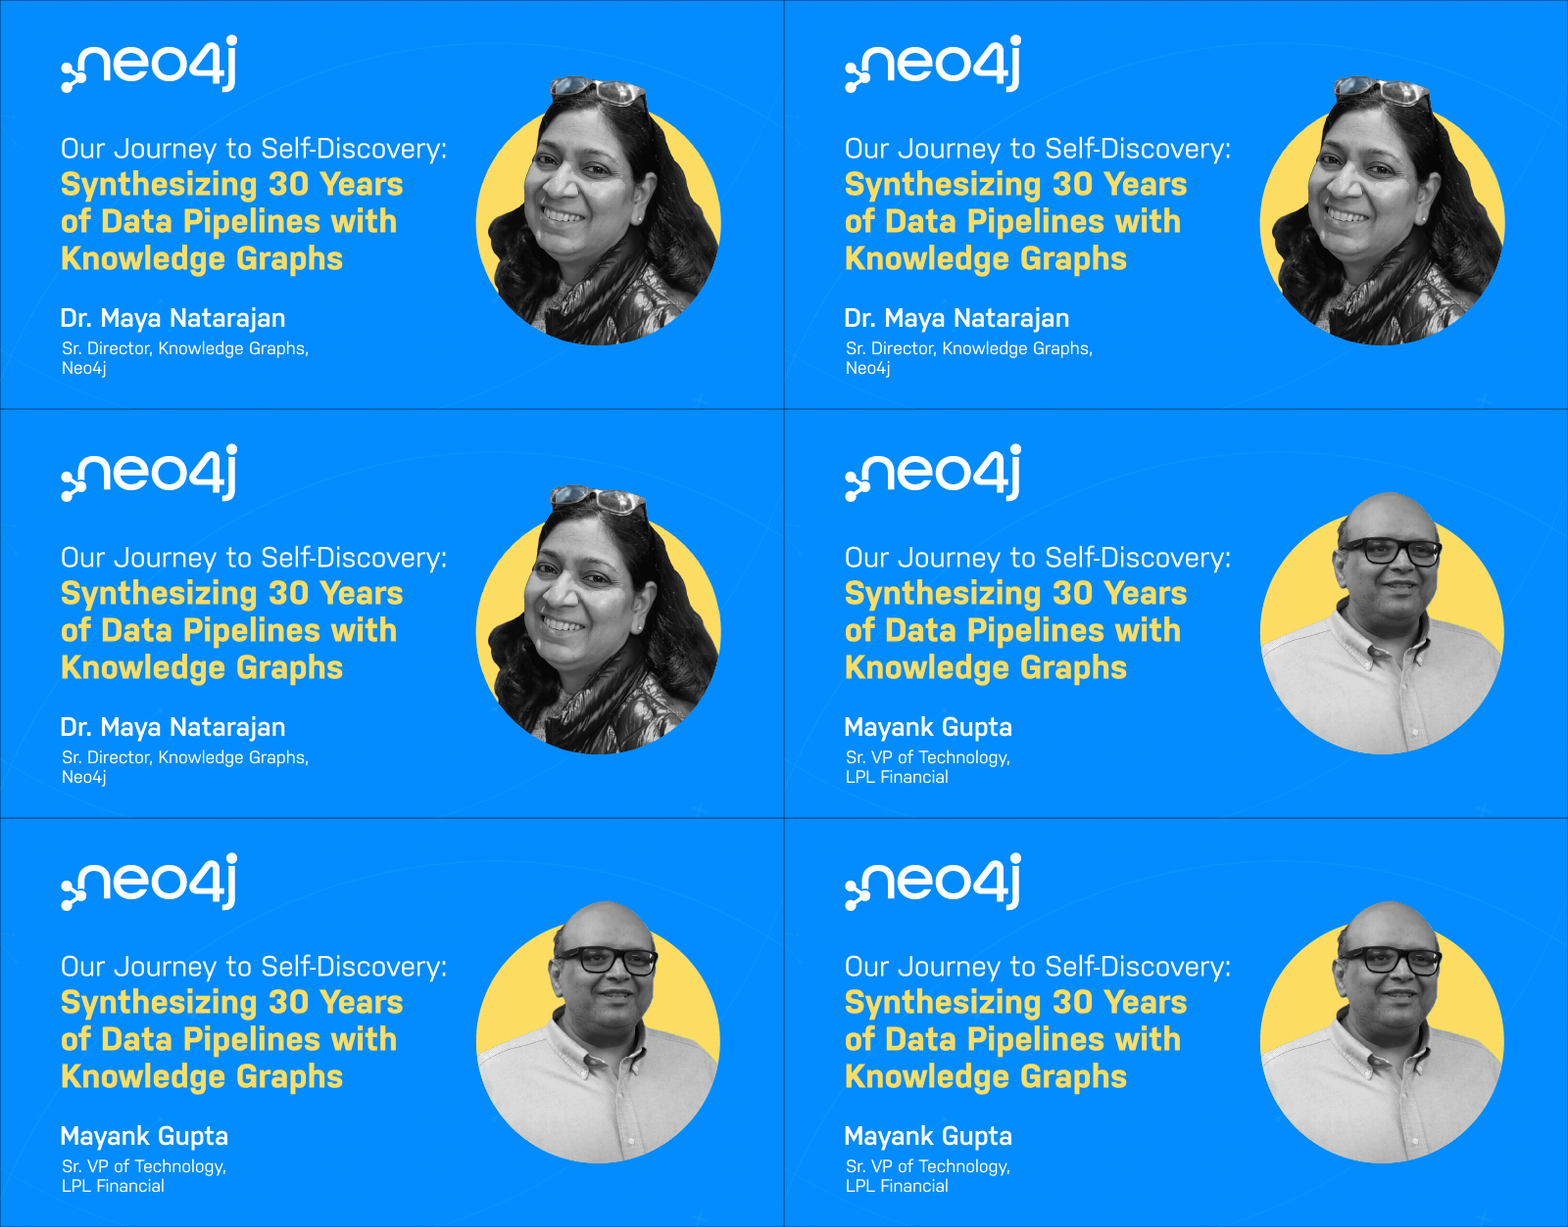
At Connections: Knowledge Graphs for Transformation, Senior Director of Knowledge Graphs at Neo4j, Maya Natarajan interviewed Mayank Gupta, Senior Vice President of Technology at LPL Financial, who described how LPL Financial uses knowledge graphs to overcome FinServ data challenges.

First Encounter with Graphs
Maya: Welcome, Mayank! I’m super jazzed to hear what you and LPL have done with knowledge graphs. I know you have been in the Neo community for at least ten years. How did you originally find Neo4j?
Mayank: I came across Neo4j at a conference in Brooklyn. It was the early days of Neo4j, and Jim Webber was introducing graph and graph databases. I was wrestling with several problems at that time, and that presentation was a paradigm shift for me. I’ve been an avid user of graph databases ever since.
Maya: Could you tell us a little bit about how you started off with graphs?
Mayank: During that conference, I had recently started at UBS and was only graph-adjacent. Prior to that, my role was really around data distribution at Morgan Stanley. There we had built a system that essentially inventoried all of our data sources and mapped them to a logical model, the questions that users would ask. We used graph-like constructs and conducted searches to find paths from the questions users had to the answers. We never called it graph or knowledge graph or graph database.
When I joined UBS, we formally built something called the integrated data platform, and at the heart of that was a Neo4j-based knowledge graph, which housed all the sources and logical mappings, as well as pathways and schedules for when data is available. We also experimented with and took live a rules-based access control mechanism with graph databases, a very natural fit for graphs. Both of these use cases, which are very common in the industry, have knowledge graphs at their core.
Maya: Your journey with graphs dates back to even before you joined LPL. In fact, the initial use cases that you just outlined focus on role-based access control lists, which is really important from a security point of view. Interestingly, this is still one of our bread and butter use cases, though the scope has expanded quite a bit. Now it’s the centerpiece of how companies are proactively identifying cybersecurity risks and preventing flaws. It’s exciting that even 10 years ago, this was so important, and it continues to be important.That brings us to LPL. How and where did the LPL knowledge graph journey start?
Solving Graphy Problems at LPL Financial
Mayank: Where you have complex data models and modeling that are changing very rapidly, graphs are such a natural fit. To me, they are like the uber data structure. All other data structures can be described in graphs, and that’s their power. That is truly the heart of the value proposition in graphs.
When I joined LPL, we had a fairly severe problem that we were dealing with. We have a very account-centric data structure, and part of our responsibility is surveillance. We monitor for suspicious activity occurring in accounts and we would actually get a lot of triggers for suspicious activity happening. We found that the system was calling the same people and households multiple times because they had multiple accounts with us.
With the very first deployment of a graph at LPL, we used Neo4j to load up our accounts, derive clients from those accounts, and then collect household nodes by connecting together clients in the same household. That was pretty powerful. We got not only our main use case met, but we also discovered a lot of data patterns. Where we had heavy clustering, we were suspicious and had questions. Why do I have so many people with the same SSN? Why do I have so many people in the same town? It actually went above and beyond what we had intended with just being able to know our households and reduce the number of alerts.
From there, we asked, “How else can we apply graph?” Our next really serious effort with graphs was around financial concepts and health documents using a company that Neo4j introduced us to called Graph Aware. Essentially, they analyzed text and created a knowledge graph to improve our search results, with the intent being that when our advisors or home office users enter in search terms, they get much better efficacy. This proved itself invaluable because it started to drive down calls to us, a bottom line concern for us, and improved advisor experience because they were getting to their information from their question faster.
In the financial world, there tends to be many relationships. So, I will have an insurance client, who I will introduce to an advisory company or a colleague who does advisory consulting. Those financial consultants may then introduce clients to sponsors who have products that are a good fit. As you can see, these are complex relationships, so we’ve been using our graph database to really house and drive those organizations and relationships. Knowledge graphs have really improved our engagement with our clients.
Maya: You hone in on the important point that relationships matter, and that’s what graph databases allow you to surface. It’s fantastic that LPL has built so many use cases on top of a knowledge graph. I recently read that LPL made it onto the Forbes 500 list. Congratulations! Can you tell us a little bit about that and any challenges you had to overcome?
The Challenges
Mayank: It’s both exciting and somewhat scary at the same time, at least for us in the data department. What we’ve been seeing over the last five to six years is, as we improve our offerings and the country engages more and more with independent advisors, we’re experiencing a sustained increase in transactions and business volumes. Our business has been rapidly growing, so we’re onboarding far more practices and advisors, which brings on a lot more accounts and assets under management. We’re seeing both organic and inorganic growth at LPL that is rapidly driving our processing demand. We need to increase throughput and resiliency while also being able to handle scale. Financial service firms know that our volumes can be very spiky. On a bad market day, we get hammered and have to be able to accommodate that. Along with that, what we need and want to do is improve our value, provided that the quality of our data and the efficacy of our experiences and information are enabled. It’s very important for us to do this while at least maintaining, if not bending, our cost curve.
This is a pretty intense problem statement for a set of data pipelines that have been built up over the last three decades, and they’ve been built up in a very staccato fashion. What we’re trying to do is apply the principles of knowledge graph to really not look left or right, but to instead look inwards for self-discovery in our data department when it comes to how it functions and transforms.
Maya: Is data silos one of your issues as well?
Mayank: Our data is siloed, but within a couple of monoliths. This means that the infrastructure is shared, but the logical constructs are all disparate. Typically, when you see data in silos, that data is first in machine A, and then it’s in machine B, and then in machine C, and all of those are located in one place. Even with this, the data is not really connected together, and creating those connections are a big part of what we want to improve.
For our data pipelines, we have a variety of data sources with different volumes and formats, so we look to create integration points. For example, this is a comma-separated file, and this is the separator. These are the column names, and this is how they tie to each other. Or this is a JSON document or series of JSON documents, or this is a stream.
Once you’ve structured the data, you ask questions like: “I’ve got this file that has 15 columns in it. What do these columns mean? How do they matter to me?” I call this creating a semantic construct for a data pipeline, where a person maps the stored data to its logical construct.
Even after you’ve finished this first mapping, you have to get that data prepped for different distribution and consumption patterns. This means having to shape and sort of sort the data for the different contexts the data will live in.
Knowledge Graph Is the Solution
Mayank: To answer all these questions involved in creating a data pipeline, a knowledge graph can be really useful. Perhaps information is locked away in configuration files or code or just in people’s heads. Getting all of that knowledge out and deeply embedded in a knowledge graph makes the pipeline creation much faster because you’re more likely to implement the right thing the first time, rather than having to go through multiple implementations. Having a total view of the pipeline in a knowledge graph enables incredible efficiency and visibility for the firm.
So now we come to the hard part: How do I go from that raw data to my intermediate physical structures? How do I go from my physical structures to my data preparation processes and ultimately curate datasets for various contexts? When we get into the processing details and capture those in a knowledge graph, we’ve essentially coupled the data practitioner’s needs and the data pipeline.
Maya: Thank you very much for walking us through that data pipeline journey. I think the beauty of knowledge graphs is that they provide an intermediate insight layer where it connects everything. As a business leader or a CIO, you’re not changing the data landscape or infrastructure in any way, but connecting everything in that knowledge graph layer, which can be consumed by different use cases. I’m sure a lot of other companies look at data pipelines in exactly the same way.
Mayank: You’re absolutely right. We had a Gordian knot of 30 years of data pipelines and started to ask ourselves: How do we tease these apart? The problem is that we don’t know what’s going to impact what. I think it’s the same case at many enterprises, especially older ones.
The transparency we gained from knowledge graphs really enabled us to modernize our decision-making. By laying bare the pipeline, and the implementation challenges involved in meeting the needs of a specific user, you drive towards better outcomes. Before, the data department sat between the producer of data and the consumer of that information. Knowledge graphs allow the data department to get out of the way. Now we enable our producers to provide data better and give them a feedback loop based on the challenges facing our data consumers. Now we can resolve problems and even avoid problems because of the transparency.
Maya: You’ve added to the “Knowledge Graphs for Transformation” theme of today’s conference. Not just with AI, but even with your regular non-AI use cases. I’m sure there are only a few others who have had so much experience with knowledge graphs. In this entire journey, what would you say was your aha moment and what are the key takeaways that you would share with us about knowledge graphs?
Mayank: The key aha moment for me was thinking about how you describe what you know about data for the long term and in a way that you can share. I truly believe that knowledge graphs are one of the premier, underutilized tools for people to share context. We do a lot of work with ontologies and taxonomies, but if we can capture that in a knowledge graph, our understanding changes.
One of the benefits of knowledge graphs, including the one we talked about earlier, is moving the organization. If you look at a lot of the data practitioners, the analysts, the power users, they’re the decision makers in an enterprise. They want to understand where they should be investing in the next three quarters. They should be able to say: “I want to understand what the trends are that should drive my decision-making for the next three quarters.” The knowledge graph enables this intent-based style of engaging with information. That was my big aha moment.
Maya: I totally agree with you. I think knowledge graphs allow business leaders to get that value more quickly. They are one of the most underutilized technologies around today, but that’s all changing. It’s definitely the year of knowledge graphs.
Looking Forward
Maya: Let me finish off with a futuristic question: What role will graph technology play in the next few years?
Mayank: I think there’s a few trends emerging. Bill Gates and others introduced this construct of ubiquitous computing, and now we see it happening. My daughter was a fifth or sixth grader when she had the power of what would have been a massive computer back in those days in her pocket with access to all of the world’s information through voice. How can business enterprises have this same power that consumers have? Ubiquitously, you can ask questions and gain access to the answers. In enterprises, despite all our sophistication and investment in research and development, the interfaces we’ve created are not as advanced as the general ones Google and Apple and others use to solve problems for consumers. Knowledge graphs are going to become more and more prevalent in the enterprise and are going to drive the interfaces that people have today. Chat and voice are underpinned by knowledge graphs, and we’re going to see that expand greatly. How people engage with data, with analytics, with insights, with information systems is gonna be vastly transformed. This incredible trend has already started, and it’s just going to accelerate.
The second trend that I’m keenly looking forward to is the changing of the operating models underpinned by these graphs. Graphs are far more rapidly updating and self-organizing. Knowledge graphs are going to be the primary mechanism for us to capture and maintain knowledge at machine speeds and scopes rather than at the human speeds and scales we do today. This is going to have profound implications on how different industries operate and respond to changes.
Maya: I totally agree with you on that last point. Thank you so much Mayank for sharing your personal journey.


